Getestet · W7-TEST · Historical simulation
Trading Rush Donchian: one rule choice changes the test
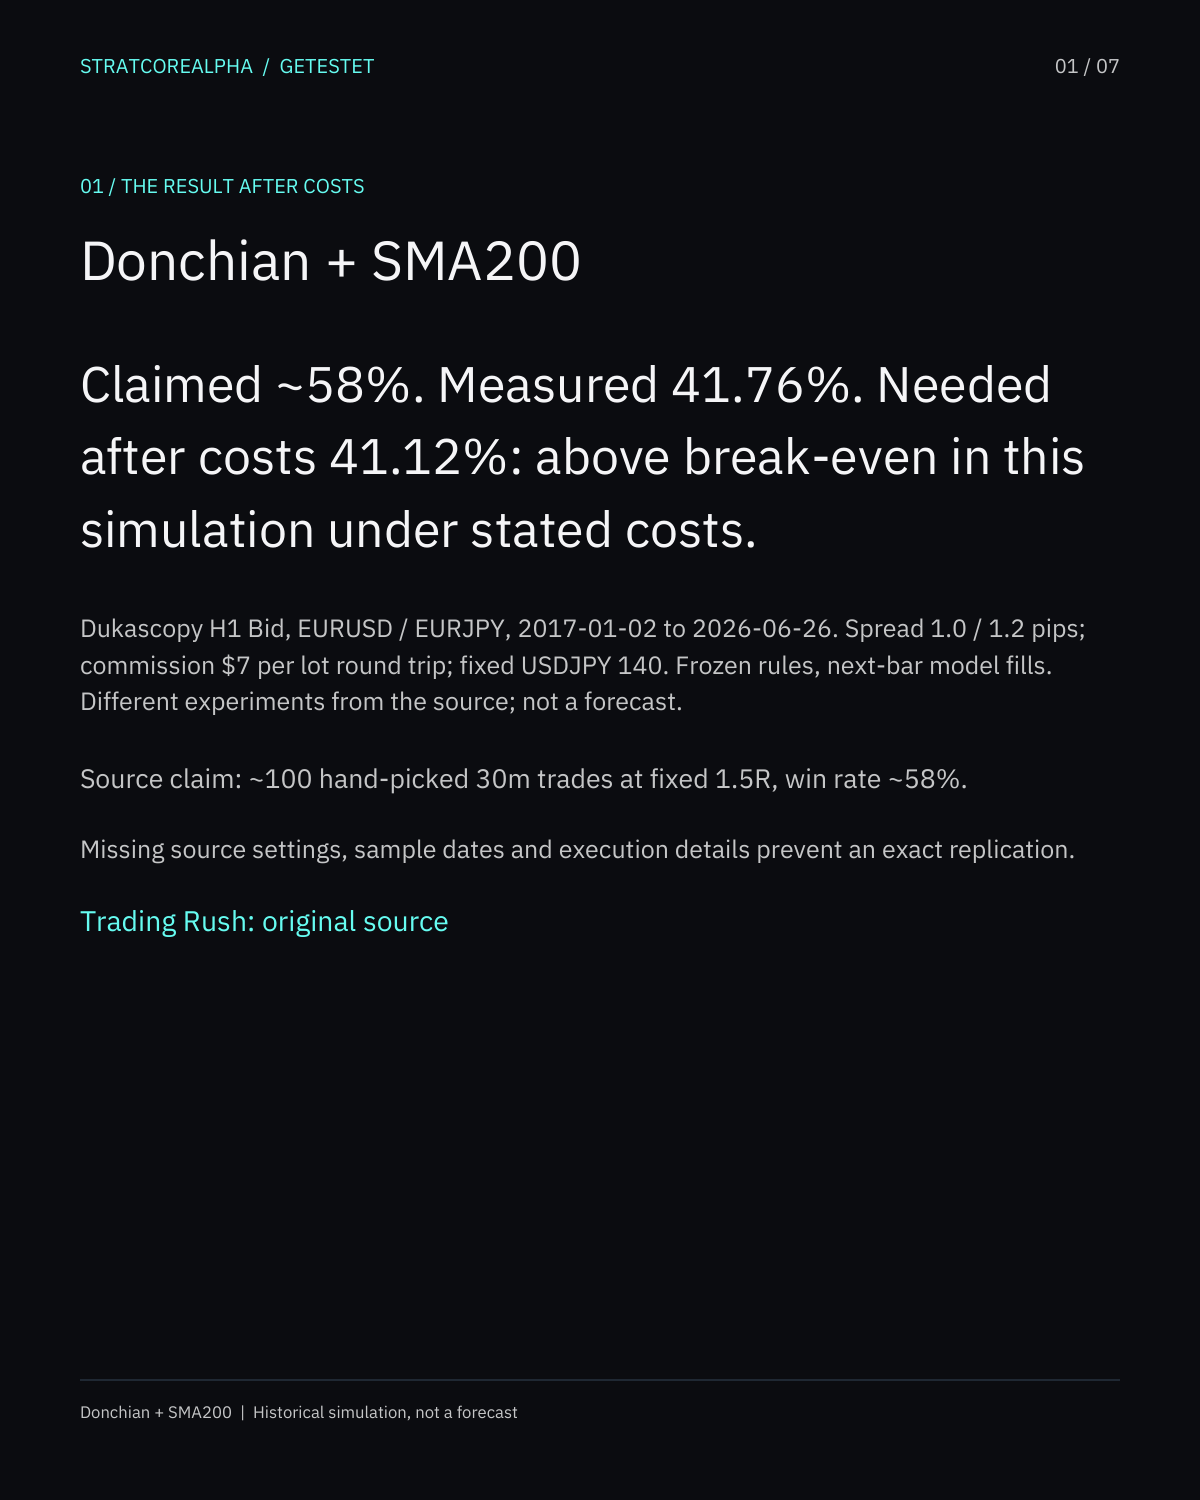
Claimed ~58%. Measured 41.76%. Needed after costs 41.12%: above break-even in this simulation under stated costs.
Measured under the frozen rules
41.76%1,021 trades, 426 TP / 594 SL / 1 END, win rate 41.76%.
The source and this run are different experiments. Missing settings and sample details prevent an exact replication. Model fills are not observed broker execution. No profit or challenge-pass claim.
The article reports roughly 58% wins in 100 selected 30-minute trades. It leaves the Donchian length and the counted fixed-stop distance open. A repeatable test needs both frozen before seeing results.
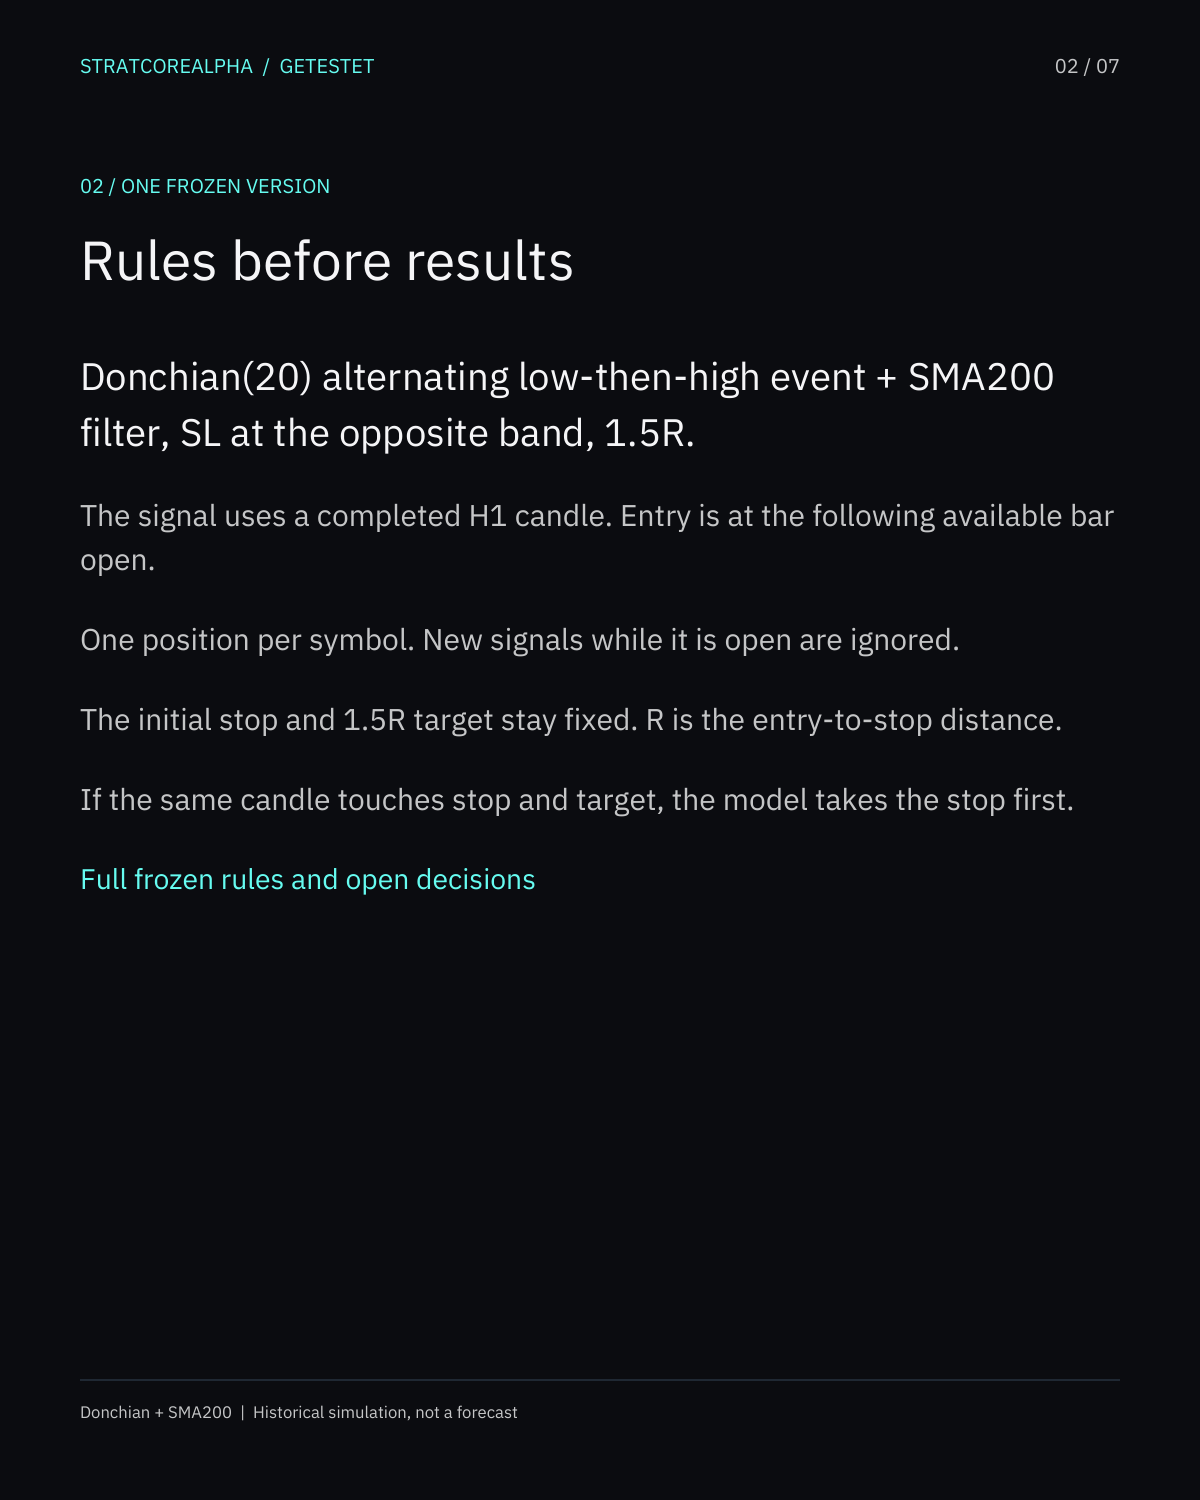
I used Donchian(20), a closed-bar lower-low then later upper-high sequence, SMA200 direction, the opposite band as the initial stop, and a 1.5R target. Entries occur at the next H1 open. The full EURUSD and EURJPY Dukascopy bid series runs from 2017-01-02 through 2026-06-26, with exits from 2024-01-01 onward set aside as out of sample. Fixed assumptions are 1.0/1.2 pip spread and $7 per lot round trip.
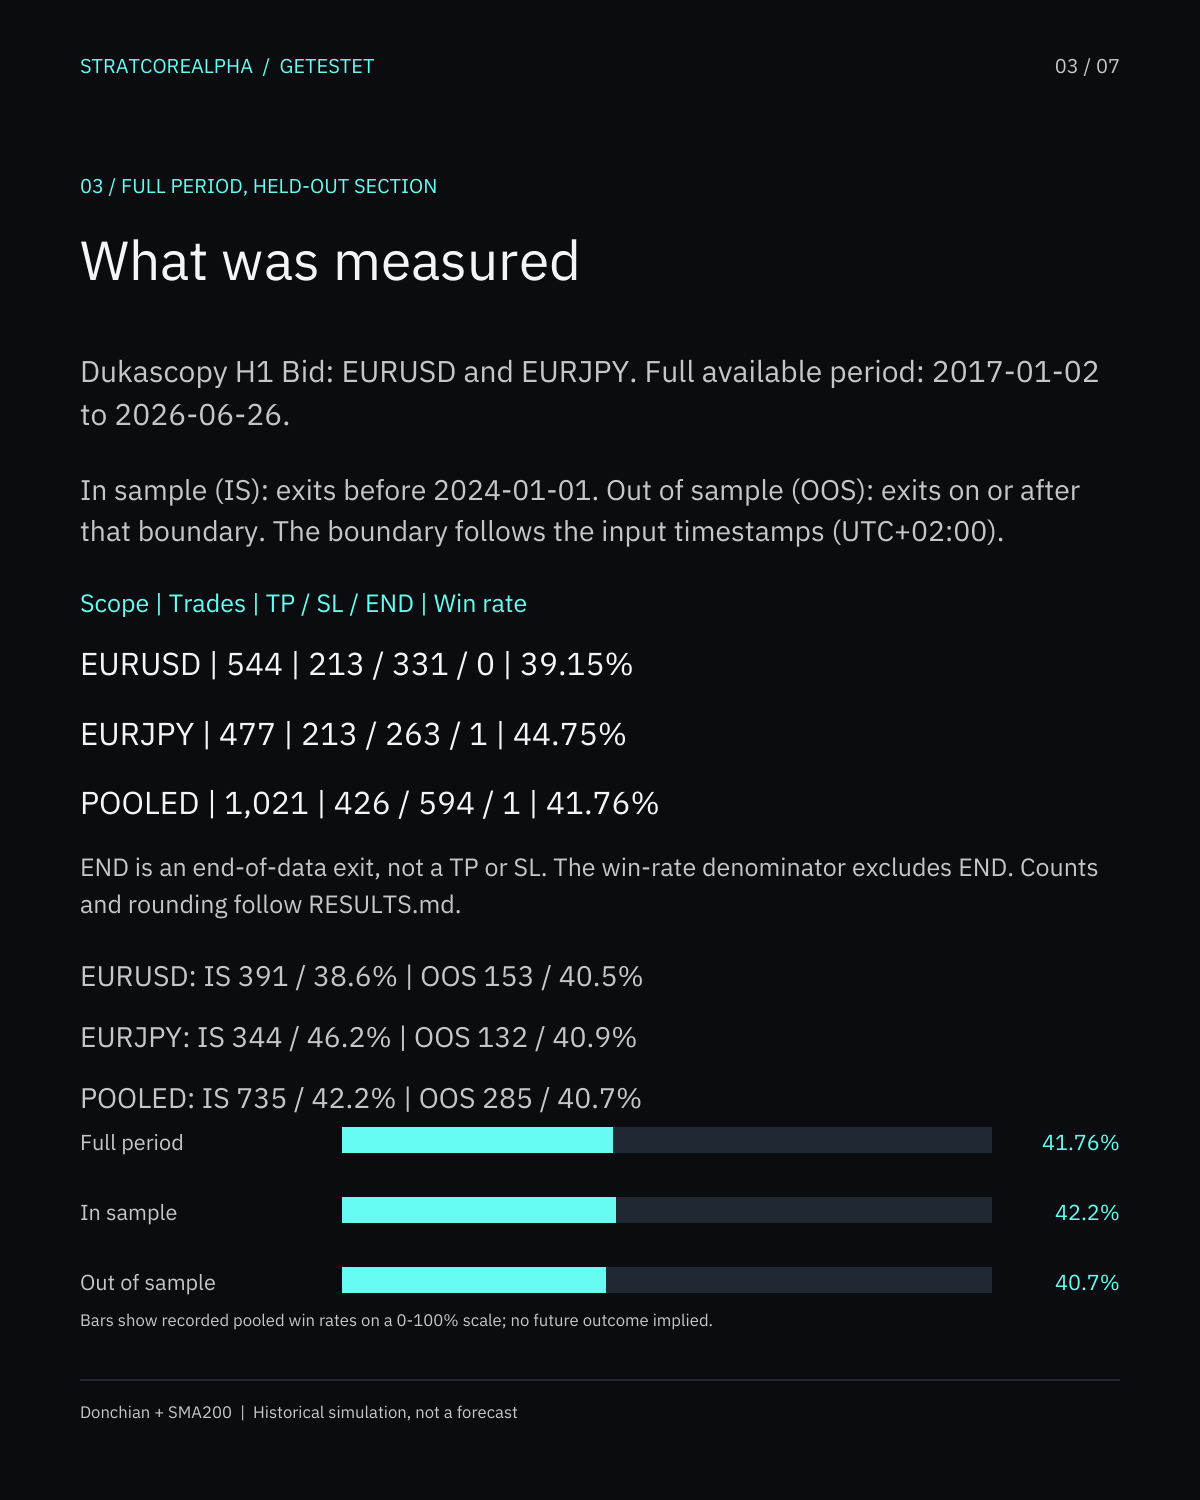
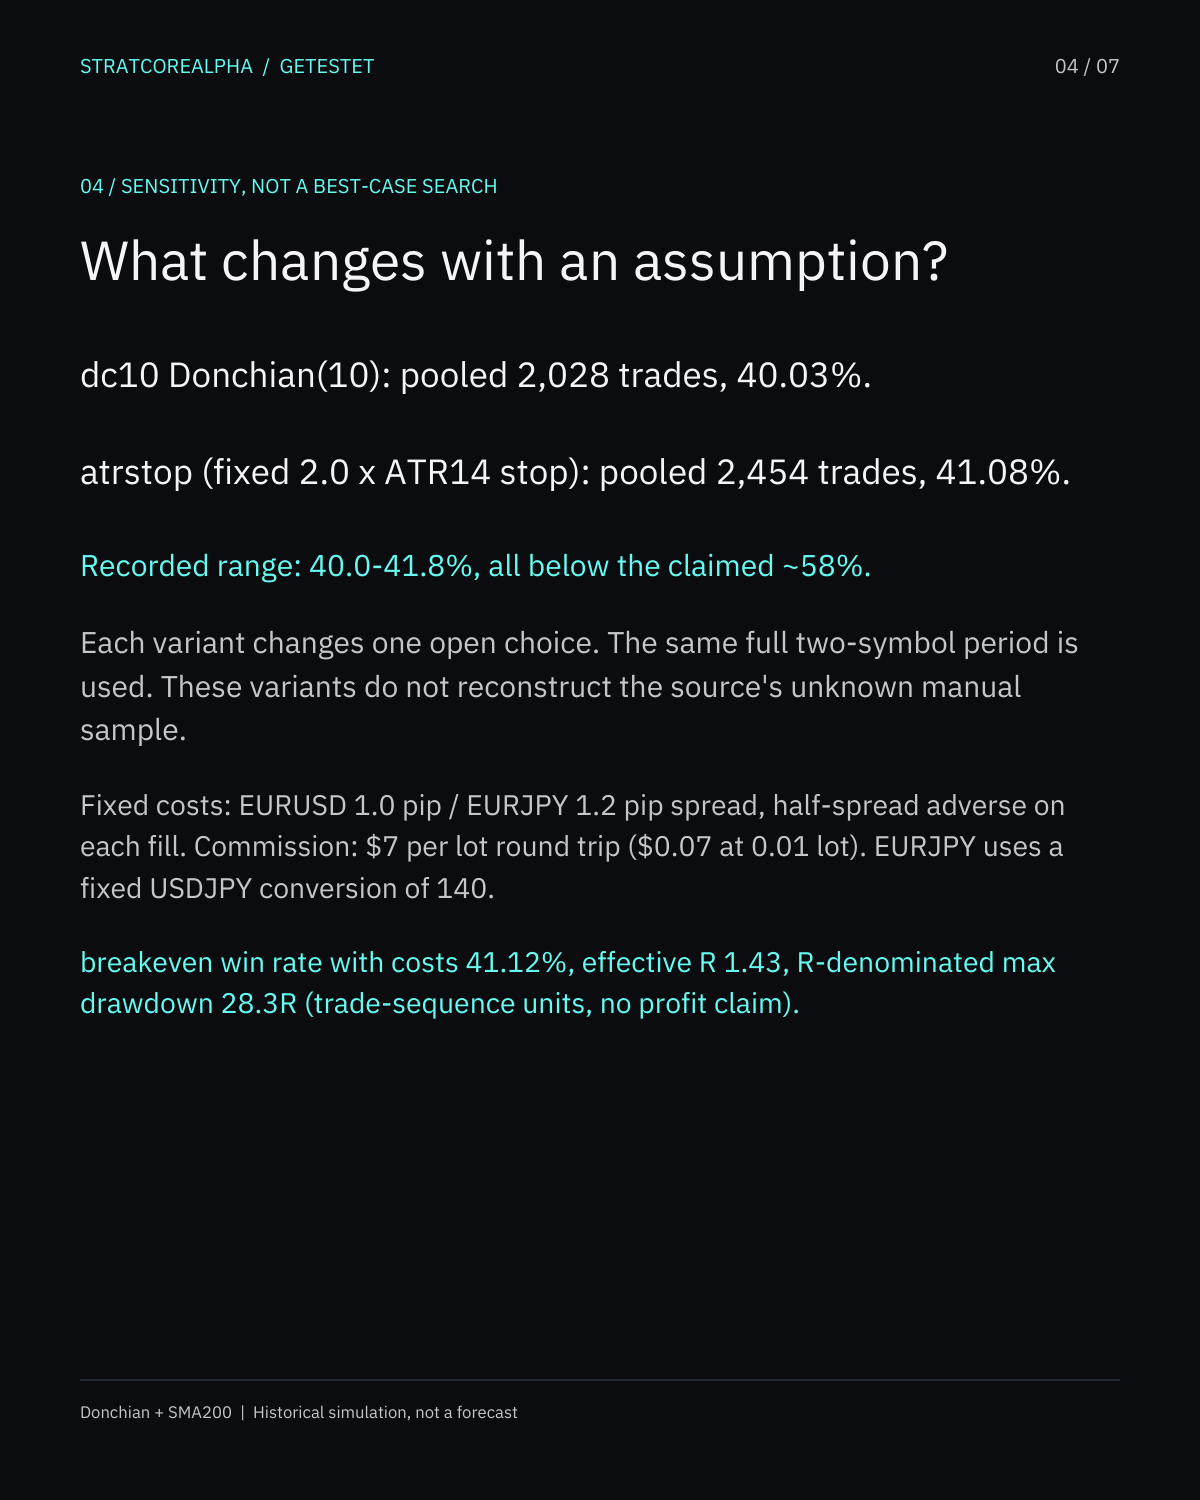
That version records 426 targets, 594 stops and one end-of-data exit across 1,021 trades: 41.76% target hits. In sample the rate is 42.2%; out of sample, 40.7%. Shortening Donchian to 10 produces 40.03%; replacing the band stop with a frozen 2 ATR stop produces 41.08%. The break-even hit rate after the modeled costs is 41.12%. These are test outcomes, not forecasts.
This does not reproduce the article's hand-picked 30-minute sample. H1 bars hide intrabar order, so a candle touching both boundaries is treated as a stop; the actual fills and costs are unobserved. The source's missing fixed-stop rule prevents a direct comparison. The useful result is the rule sheet: it shows exactly which choices a developer needs before coding an EA. Check your own rule sheet.
The recorded result
Full period and held-out trades
Dukascopy H1 Bid, 2017-01-02 to 2026-06-26. Split by exit timestamp at 2024-01-01 in the input timezone (UTC+02:00). END is an end-of-data exit and is excluded from the TP/SL win-rate denominator.
| Scope | Trades | TP | SL | END | Win rate | IS (n/rate) | OOS (n/rate) |
|---|---|---|---|---|---|---|---|
| EURUSD | 544 | 213 | 331 | 0 | 39.15% | 391 / 38.6% | 153 / 40.5% |
| EURJPY | 477 | 213 | 263 | 1 | 44.75% | 344 / 46.2% | 132 / 40.9% |
| POOLED | 1,021 | 426 | 594 | 1 | 41.76% | 735 / 42.2% | 285 / 40.7% |
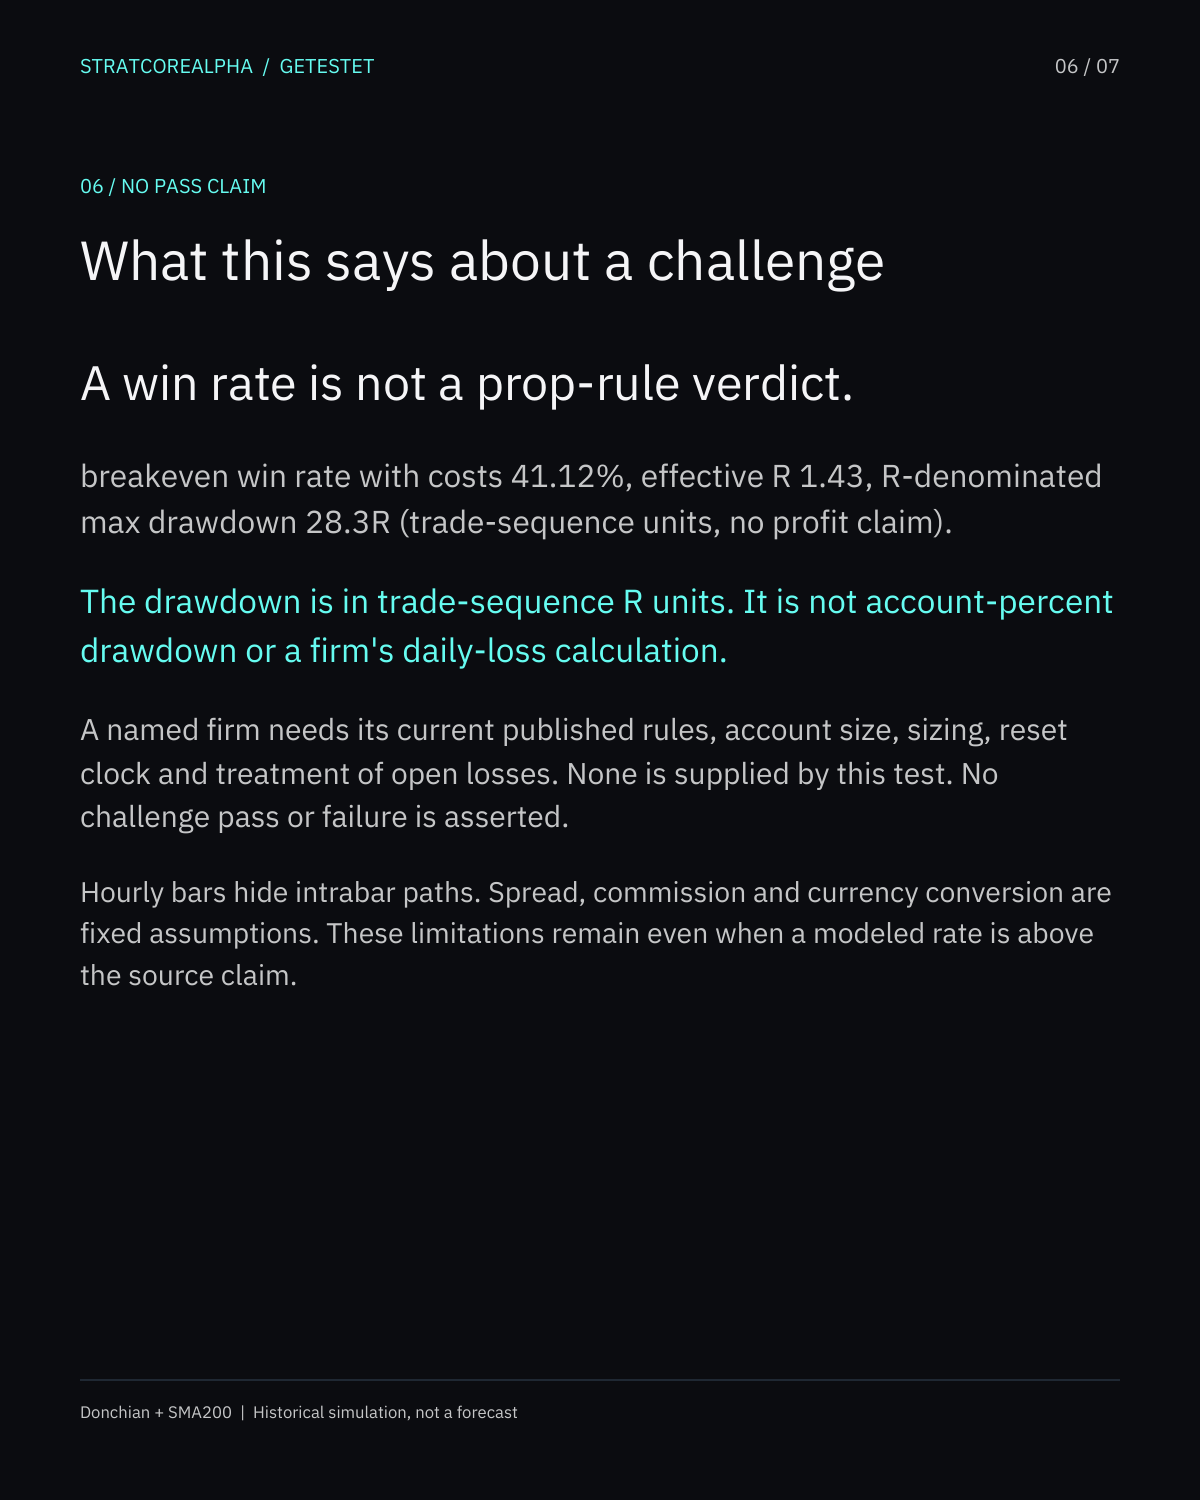
Fixed assumptions: EURUSD 1.0 pip and EURJPY 1.2 pips spread; half-spread adverse on every fill. Commission $7 per lot round trip, $0.07 at 0.01 lot. EURJPY conversion uses fixed USDJPY 140. breakeven win rate with costs 41.12%, effective R 1.43, R-denominated max drawdown 28.3R (trade-sequence units, no profit claim).
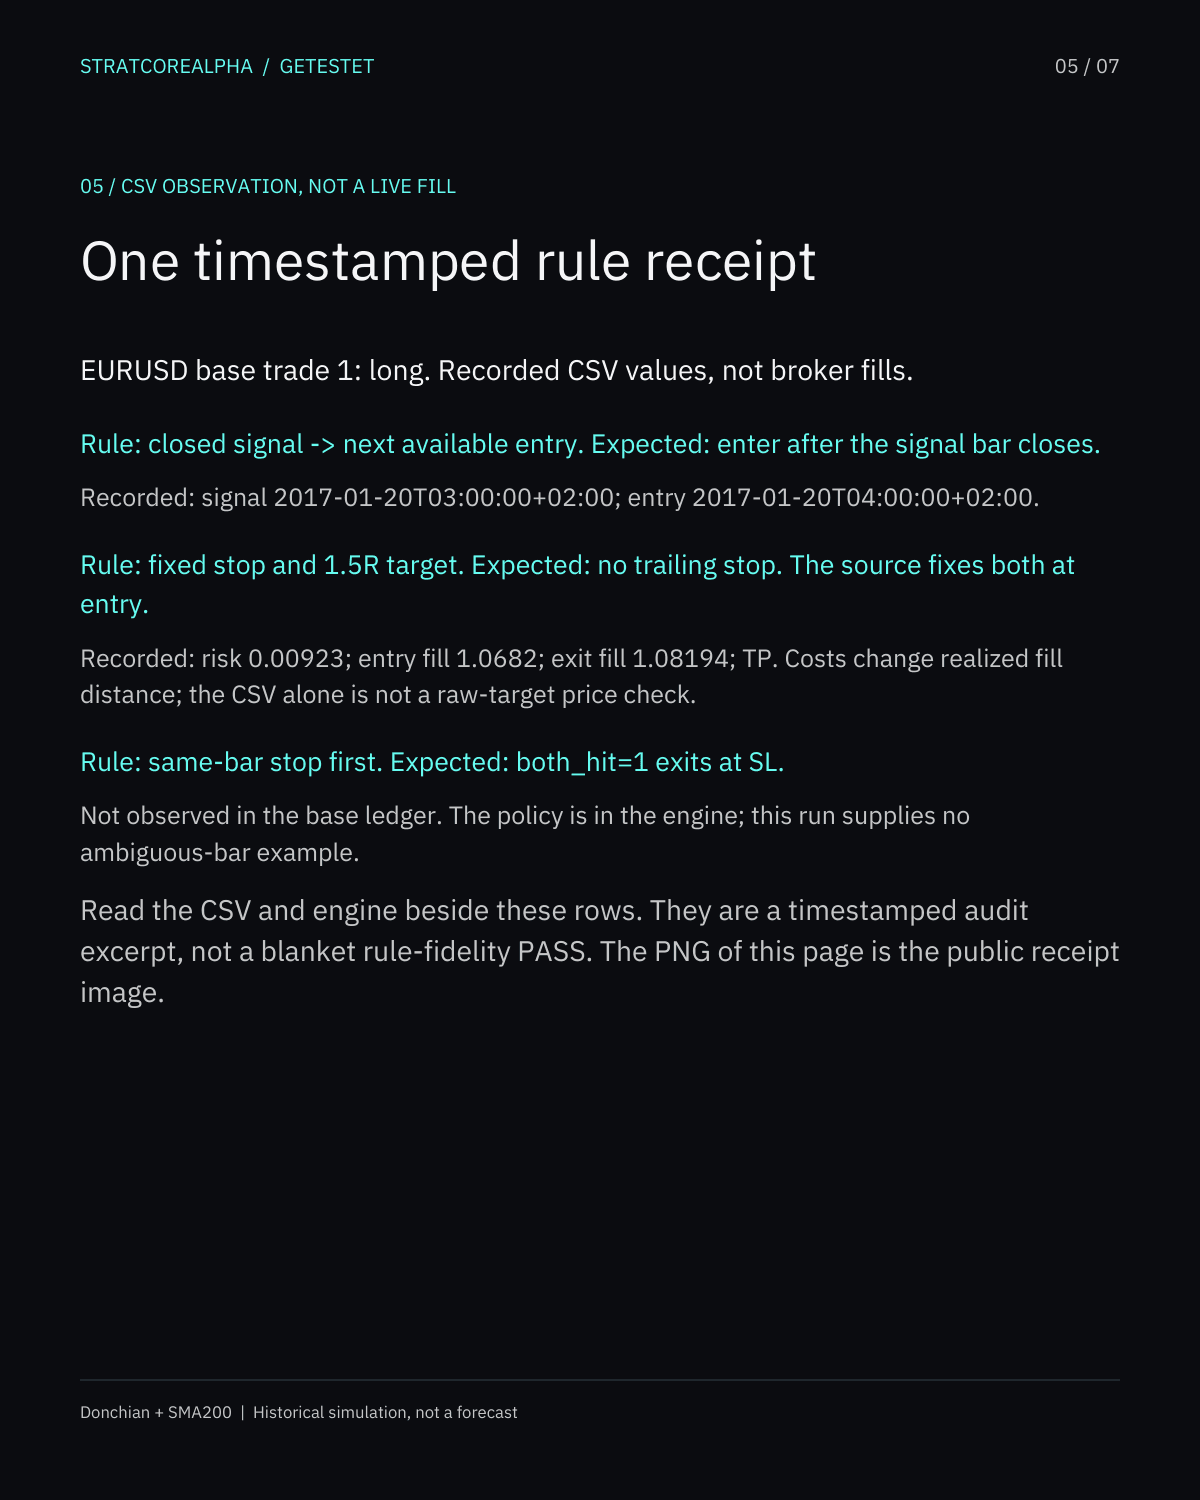
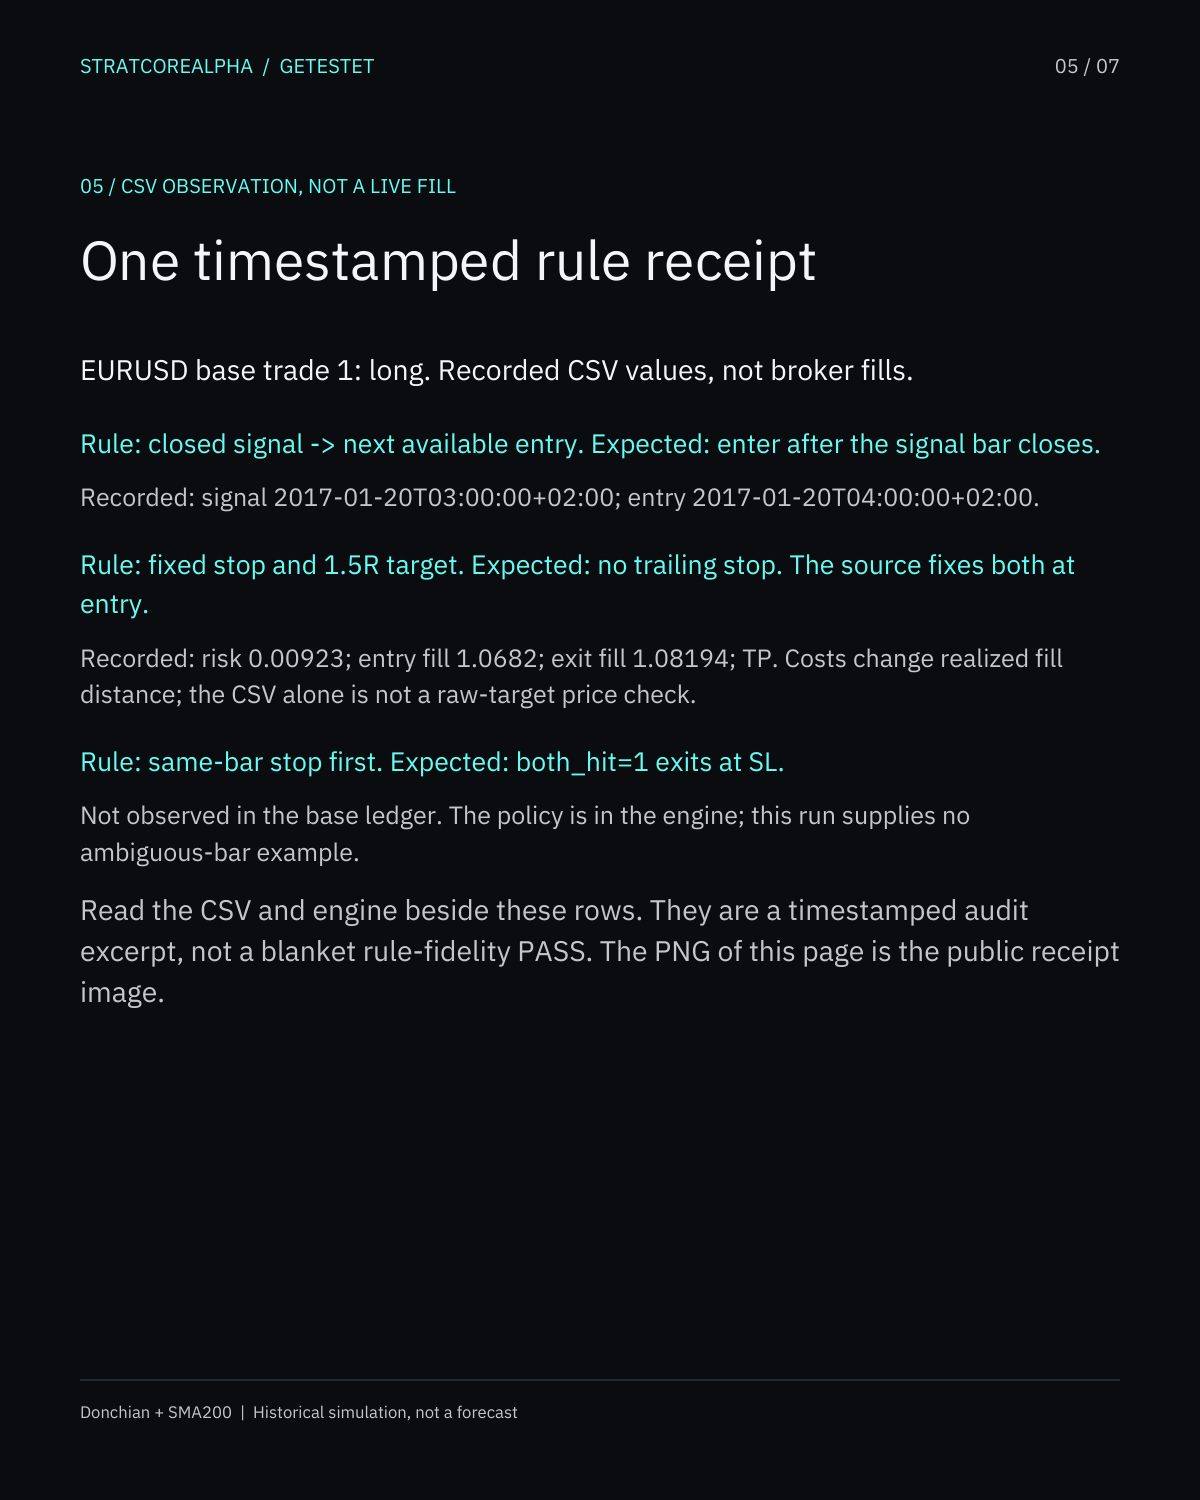
Public rule receipt
Expected rule beside the recorded output
Closed signal and next entry, fixed stop/target, and the same-bar policy. The CSV excerpt names what is observed and what the ledger cannot prove.
No email gate
Seven-page case study and audit files
The PDF and PNG pages share the same content. The CSVs, frozen rules and source code show what was counted. Raw Dukascopy candles are not redistributed.
PNG pages for reading or sharing
Your own case
An EA, a video or notes are enough to start
I write the rules; you confirm them. The direct pilot follows the T99 scope with written feedback within seven days. Current eligibility, allocation and terms are on the pilot page.
I take 5 cases free because I need real cases for my site. Loading the live number of places.
Send your EA, a video or your notesT99 is 99 EUR or USD: one strategy, one symbol, one timeframe, three agreed rule cases, a 12-month historical test and a report with limits. Historical outcomes are not forecasts.