Historical test result
My crypto momentum test lost 19% a year in its second half
Freeze your rules now and start the next test with tomorrow's signals. My daily Bitcoin and Ethereum momentum test made about 10% a year in 2018–2020 and lost about 19% a year in 2021–2023. A trader who had seen the full past asked this on Reddit (https://www.reddit.com/r/algotrading/comments/1witlif/am_i_still_overfitting_or_is_this_a_genuine_edge/).
The claim my numbers test
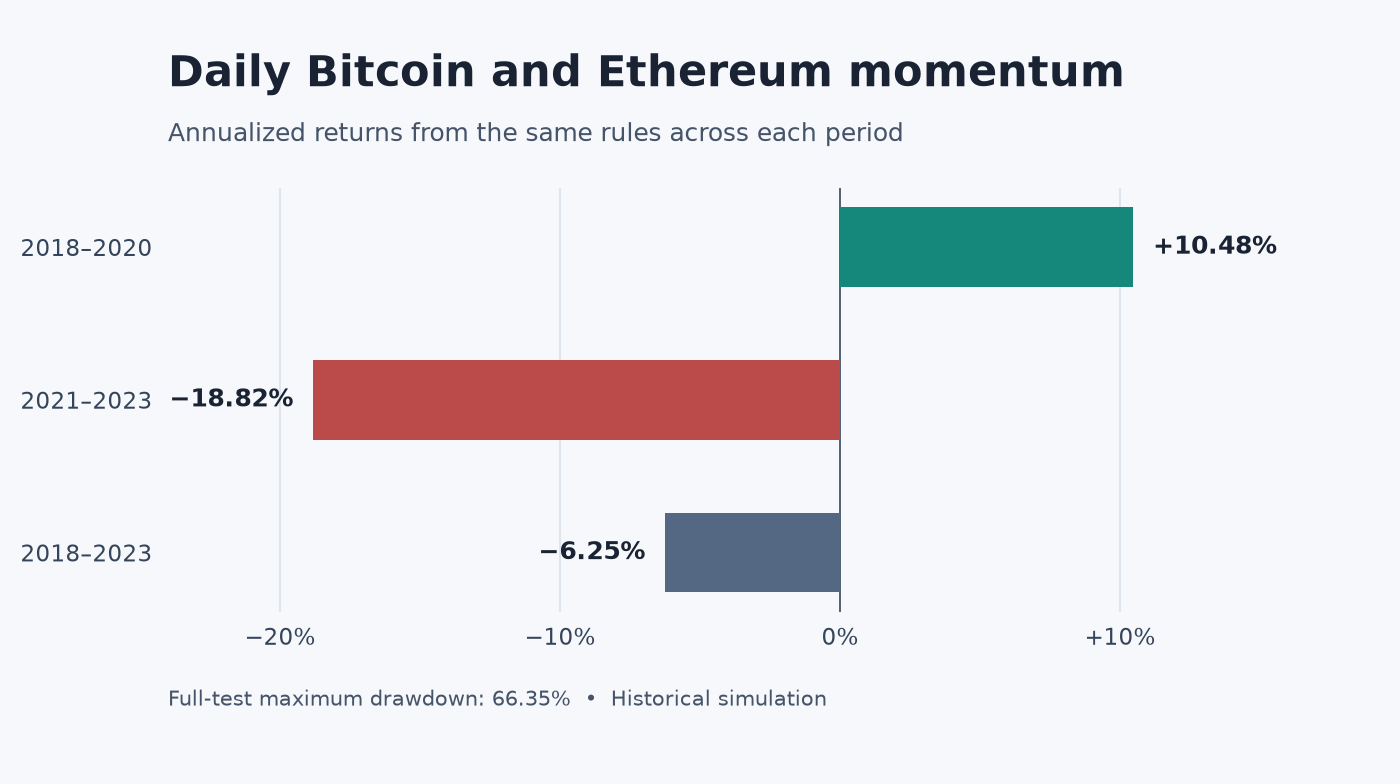
Daily momentum on Bitcoin and Ethereum keeps working. I tested that claim across two periods. My daily momentum test on BTC and ETH made 10.48% a year in 2018-2020, then lost 18.82% a year in 2021-2023. I used the same rules in both periods. The sign flipped.
What my test covers
My test covers daily BTC and ETH data from 2018 to 2023. The report splits those six years into two equal periods.
| Span | Yearly result | |---|---| | 2018-2020 | 10.48% a year | | 2021-2023 | -18.82% a year | | Full 2018-2023 | -6.25% a year | | Biggest peak-to-trough fall, full span | 66.35% |
The report lists each period's results. It gives no date for when I froze the settings.
How to read the numbers
The yearly rate is the constant rate that would give the same total return over those years. It makes periods of different lengths easier to compare. Drawdown is the fall from a peak to a later low.
Where the next test starts
You have already seen the full history. If you change the setup today, date that version and start its test with the first signal after the freeze. The BTC and ETH report omits fee assumptions. On the next run, write down fees and spread for each fill.
How to keep the fresh check clean
1. Save the exact settings and the date in a read-only copy. Lock it before the first new signal. Include the coins, timeframe, entry and exit settings, and position size.
2. Write what counts as a failure before new signals start. Example: my predeclared stop is a $500 loss limit on a hypothetical $10,000 start. I stop this check if the track hits that line. Record the starting value and loss limit in the test file.
3. Log every signal in order, including no trade. Keep the same size, note actual costs, and note the worst fall from a peak. Keep missed days in the same list.
4. Set the review date before you start. Record changes as separate versions, never as edits to the locked copy. Give each version a new date and a short note.
For comparison, the 66.35% historical peak-to-trough fall is $6,635 per $10,000 at the historical peak. That converts the historical peak-to-trough percentage into dollars at a hypothetical peak.
My call
I would rule this setup out before paying a challenge fee because it lost money in the second half and fell 66% from peak to trough across the full test.
Your five-minute check
Open your report and split it in half by date. Compare the annual result in each half, then check the biggest peak-to-trough fall separately.
Keep your limits in view
My free Rule Guard (https://stratcorealpha.com/rule-guard?ref=website) tracks your configured limits.
Sources and limits
Original question (https://www.reddit.com/r/algotrading/comments/1witlif/am_i_still_overfitting_or_is_this_a_genuine_edge/)
The chart shows my daily BTC and ETH test from 2018 through 2023. It shows the returns per year for each period and the full sample.