Engineering note · Synthetic chart acceptance
Before You Trust a Renko Backtest, Trace One Trade
A strategy report can show an attractive result while leaving a basic question unanswered: could the system have placed that trade at the time and price shown?
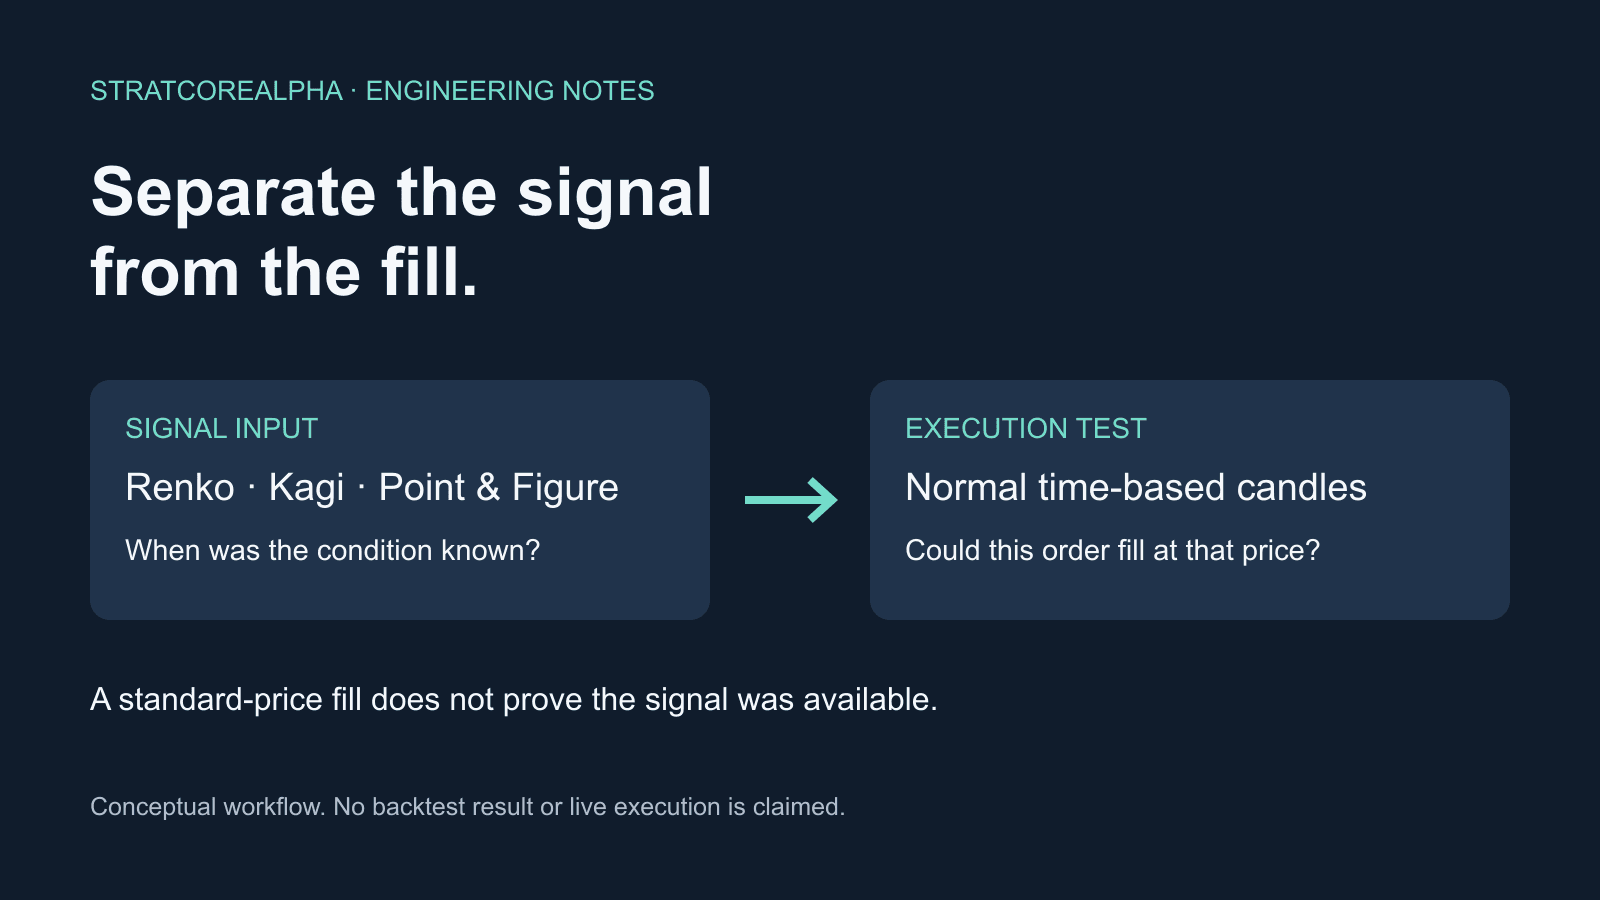
Before commissioning another indicator or adjusting the settings, trace one trade. Keep two questions separate: when the signal became available, and how the order received its fill price. Changing one does not establish the other.
Start with the price assumption
Renko, Kagi and Point & Figure charts transform price information. Their displayed levels are not a record of every price at which an order could have traded. TradingView explains that its default strategy simulation uses chart OHLC values, so synthetic chart values can produce unrealistic fills. It also notes that real-time Renko box formation differs from recorded history. TradingView's non-standard chart explanation
That gives you a practical first check. Ask which series drives the condition and which series supplies the simulated execution price. Record both. “It uses Renko” does not answer both questions.
Heikin Ashi has a specific alternative. TradingView supports standard-bar fills while calculations still use the Heikin Ashi chart. The Pine setting is fill_orders_on_standard_ohlc = true. That is a Heikin Ashi fill setting, not a general validation switch for other chart types. Pine strategy documentation
Put the events in order
Consider a hypothetical record. A report places a long entry beside a brick marked 10:00. A saved forward log first records the condition at 10:03. The historical trade uses a price of 100; the recorded quote when the condition became available is 101.
Those numbers are invented to illustrate the check. They describe two separate gaps.
Replacing 100 with a more plausible fill might address a price assumption. It does not justify making the decision at 10:00. Moving the decision to 10:03 still leaves order type, routing delay, spread and available liquidity to examine.
Do not infer these events from the trade marker alone. Preserve the signal observation, order creation and fill as separate records. If one timestamp is missing, write “unknown”.
TradingView's default strategy behavior evaluates on bar close and fills a newly created order on the next available tick, normally the following bar's open. Settings can change that simulation. An alert-based external order has its own timing, so a simulated close-price fill does not promise that price from a broker. Order creation and execution
Freeze the comparison before changing the code
Keep a small run sheet with the symbol and data source, session, timezone, chart type, chart settings, script version, inputs and calculation settings. Include the order type and the treatment of fees, spread and slippage.
Then select one signal with enough evidence to trace. Avoid selecting it because the trade won. A losing trade or rejected order can expose the same timing mistake more clearly.
Use the same frozen settings for the comparison. If you change the brick size, session and fill model together, you cannot tell which change explains a different result.
Read the records as a chain
Give the selected trade a stable identifier and keep that identifier in each record. A useful row contains the event name, timestamp with timezone, script version, signal direction and the values needed to explain the decision. Keep the original timestamp as well as any converted display time. Two entries that both say 10:03 are not comparable until you know whether they use broker time, exchange time or your computer clock.
For the hypothetical example above, the chain might contain a historical marker at 10:00, a first recorded signal observation at 10:03, an order-creation event shortly afterwards and a separate fill event. A missing event stays missing. Do not backfill a supposed signal-observation timestamp from the historical marker, because that would remove the very discrepancy you are investigating.
The record also needs a clear status. Distinguish an observed condition from an order request, and distinguish an order request from an accepted or filled order. If the order was rejected, preserve the rejection instead of treating the absence of a fill as a data-cleaning problem. That unsuccessful path is part of the behaviour the buyer needs to understand.
This small chain is more useful than a larger report that joins events by approximate time alone. It lets a reviewer point to the exact unsupported step without claiming that every other trade has the same fault.
Three acceptance cases
1. The signal was available before the order. Save a forward observation with its timestamp and the input values used. Match it to the order-creation record on an ordinary time-based chart. Pass only when the ordering is explainable without information that arrived later. A historical marker without a matching observation remains unverified.
2. Reloading does not silently rewrite the evidence. Preserve the original observations before reloading. Compare their timestamps, direction and relevant values with the reconstructed history. Record every discrepancy. A difference does not tell you its cause by itself, but it prevents the reloaded chart from replacing the original record unnoticed.
3. The fill assumption is explicit. Identify the modeled price, the order's constraints and the earliest permitted execution event. Compare those with any available execution evidence and record costs separately. Normal OHLC bars alone may not resolve the sequence within a bar or establish available liquidity. Mark that limit instead of treating the bar's range as proof of an achievable fill.
These are proposed acceptance tests, not results from a tested strategy.
What a useful handover contains
Ask for the run sheet, the event records, the three case results and a short explanation of each unresolved difference. A screenshot of the final equity curve can accompany them, but cannot replace them.
Passing one traced trade does not validate the whole strategy. It establishes a repeatable check you can apply to other signals, sessions and failure cases. Start there before trusting the aggregate report.