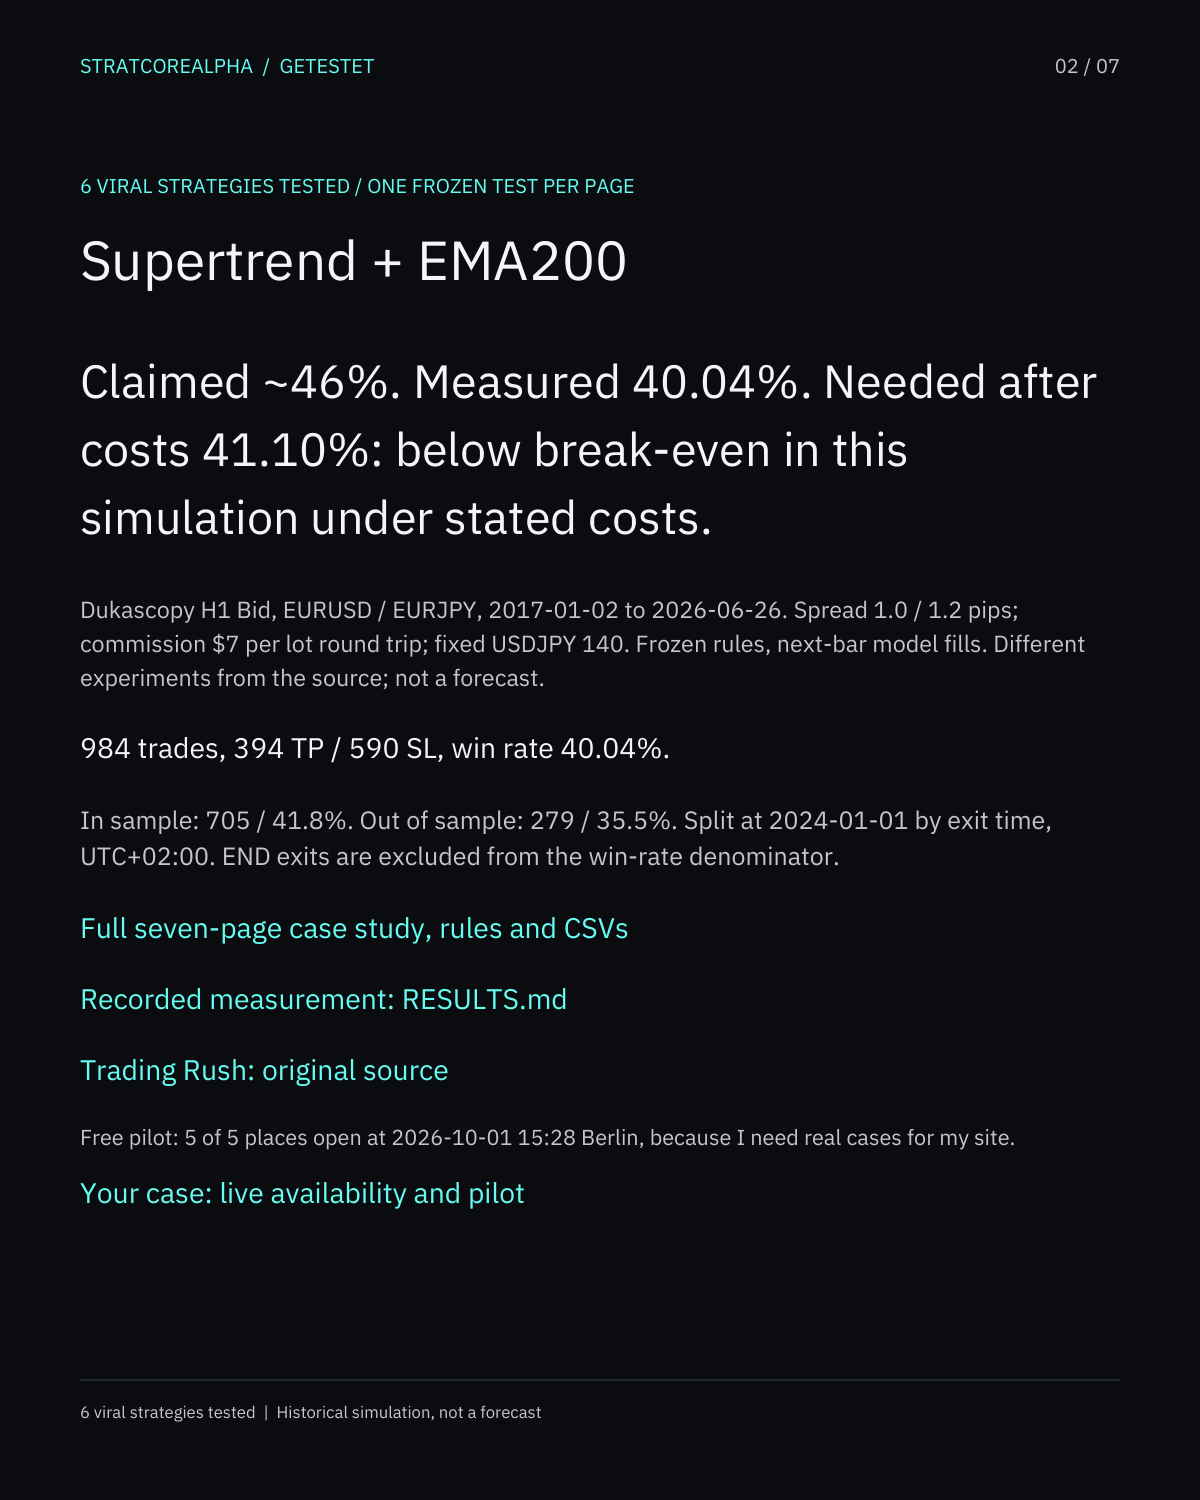
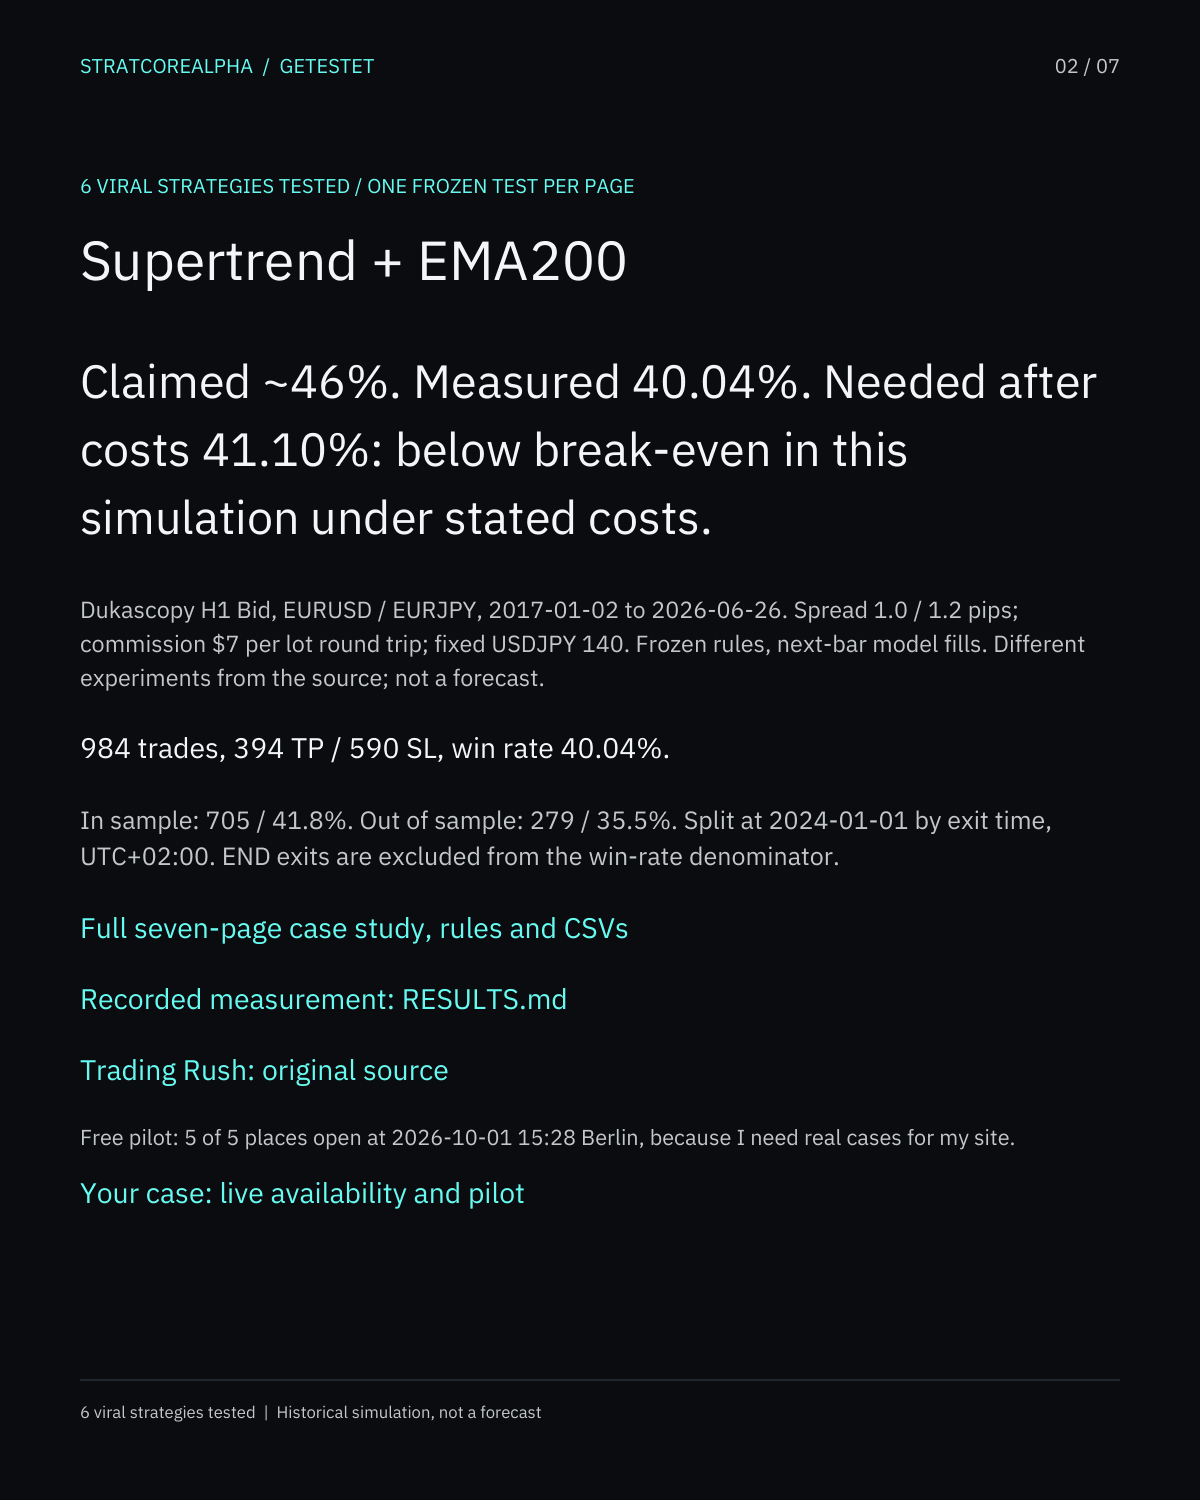
Supertrend + EMA200
Claimed ~46%. Measured 40.04%. Needed after costs 41.10%: below break-even in this simulation under stated costs.
Getestet · Six frozen historical tests
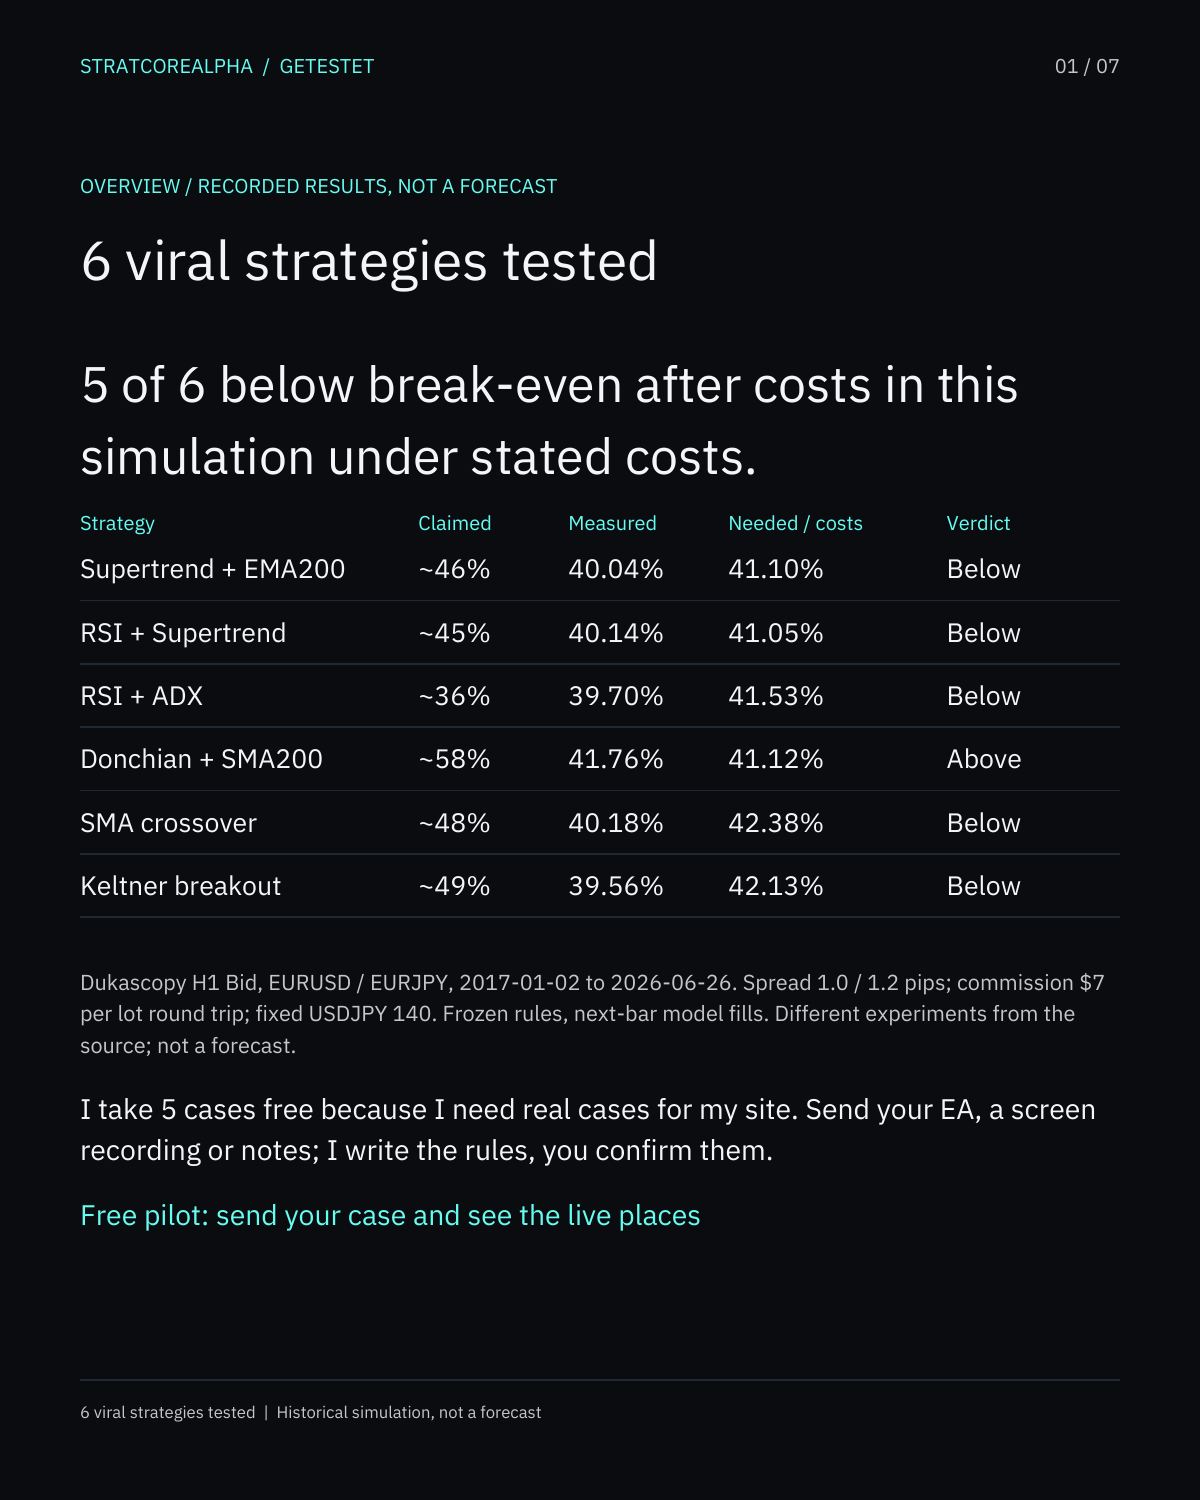
5 of 6 below break-even after costs in this simulation under stated costs.
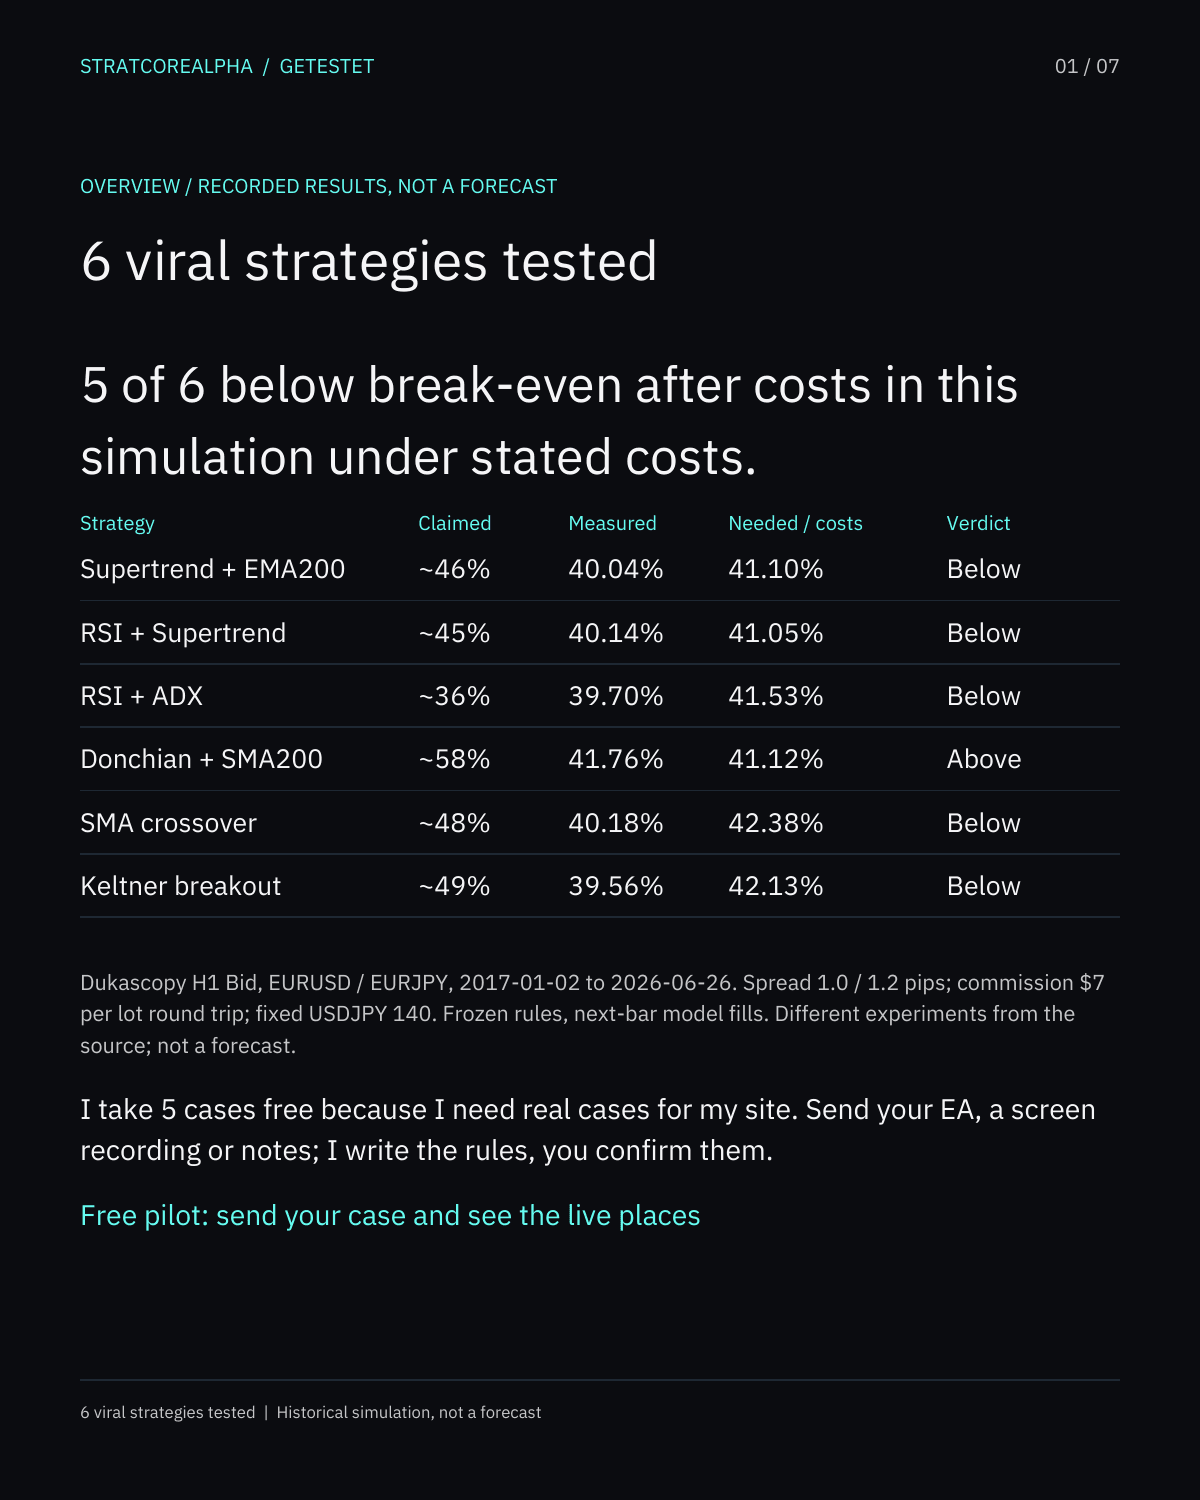
| Strategy | Claimed | Measured | Needed after costs | Verdict in this simulation under stated costs |
|---|---|---|---|---|
| Supertrend + EMA200 | ~46% | 40.04% | 41.10% | below break-even |
| RSI + Supertrend | ~45% | 40.14% | 41.05% | below break-even |
| RSI + ADX | ~36% | 39.70% | 41.53% | below break-even |
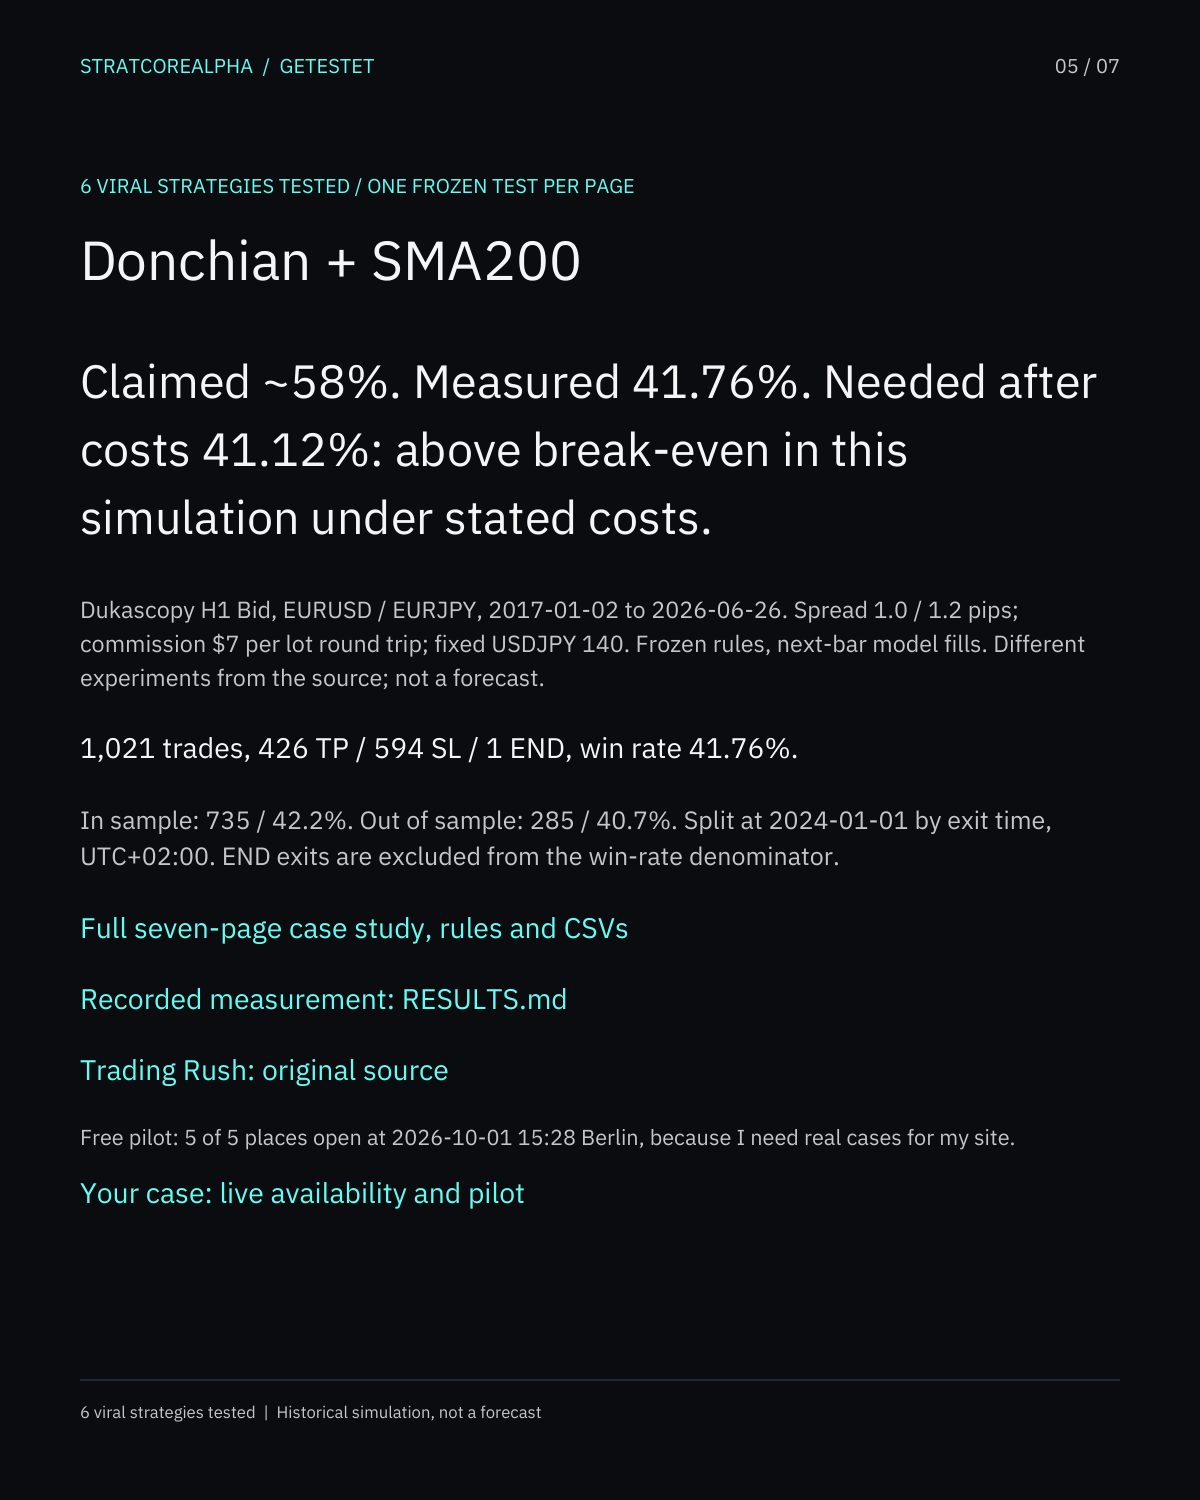
| Donchian + SMA200 | ~58% | 41.76% | 41.12% | above break-even |
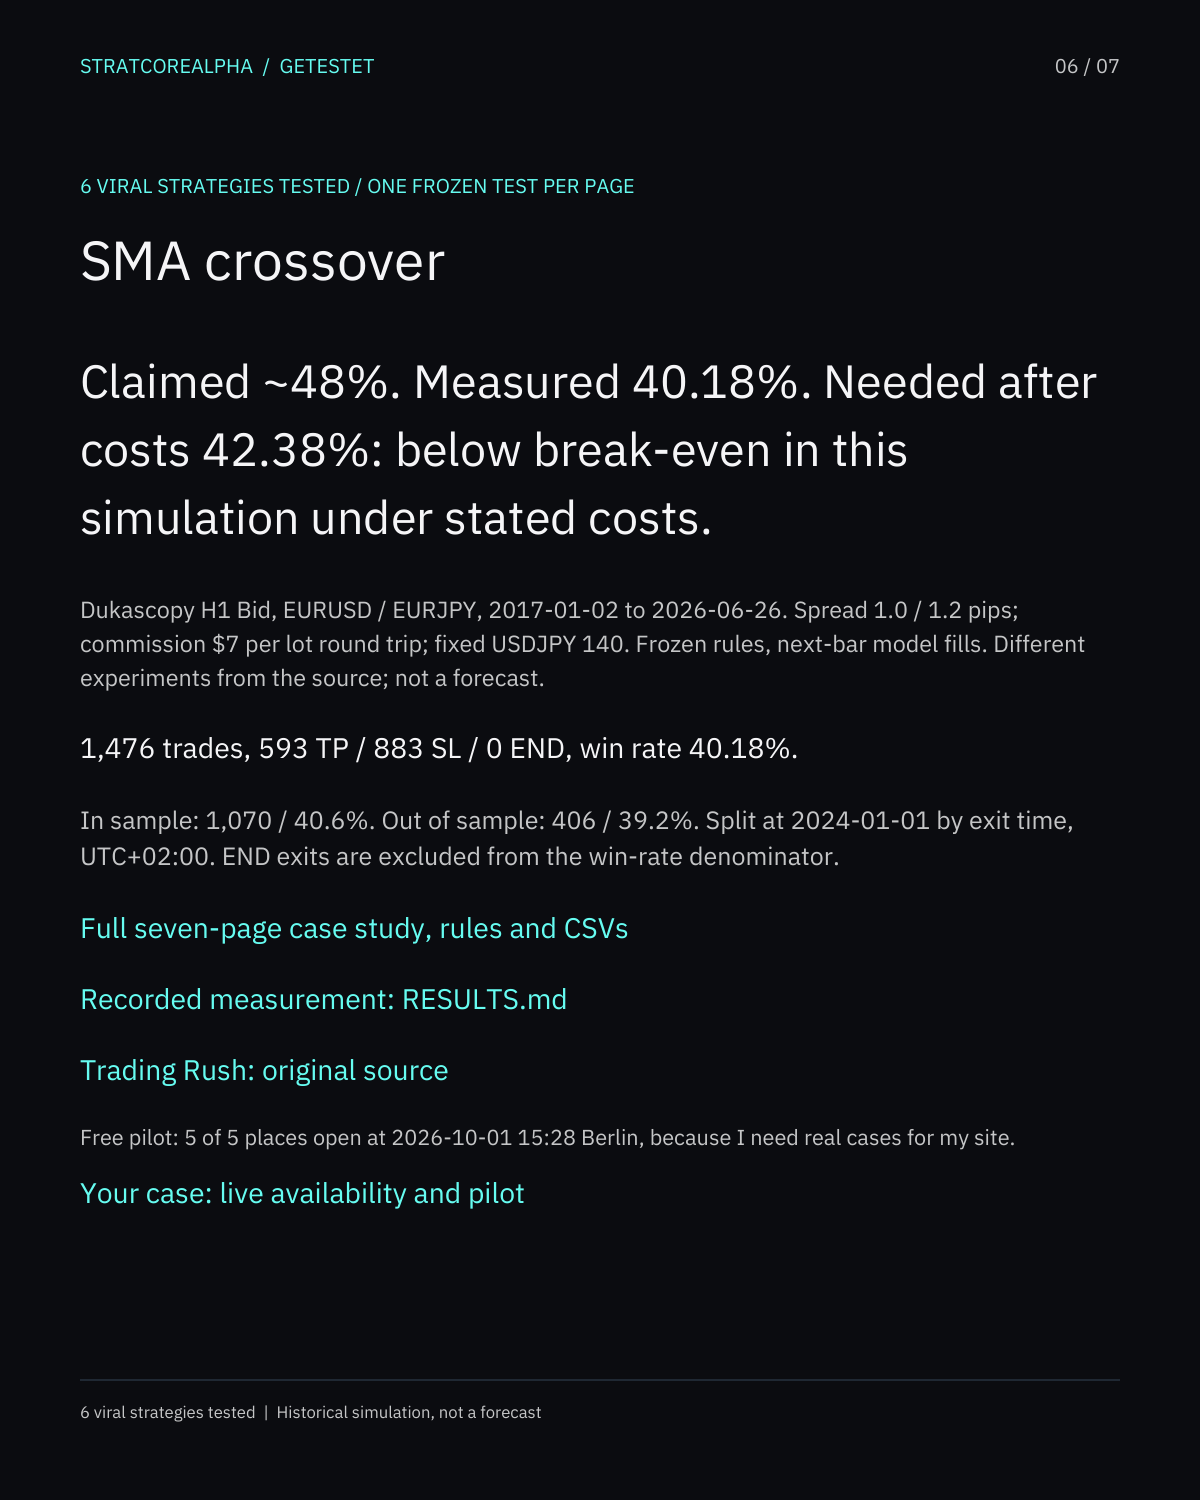
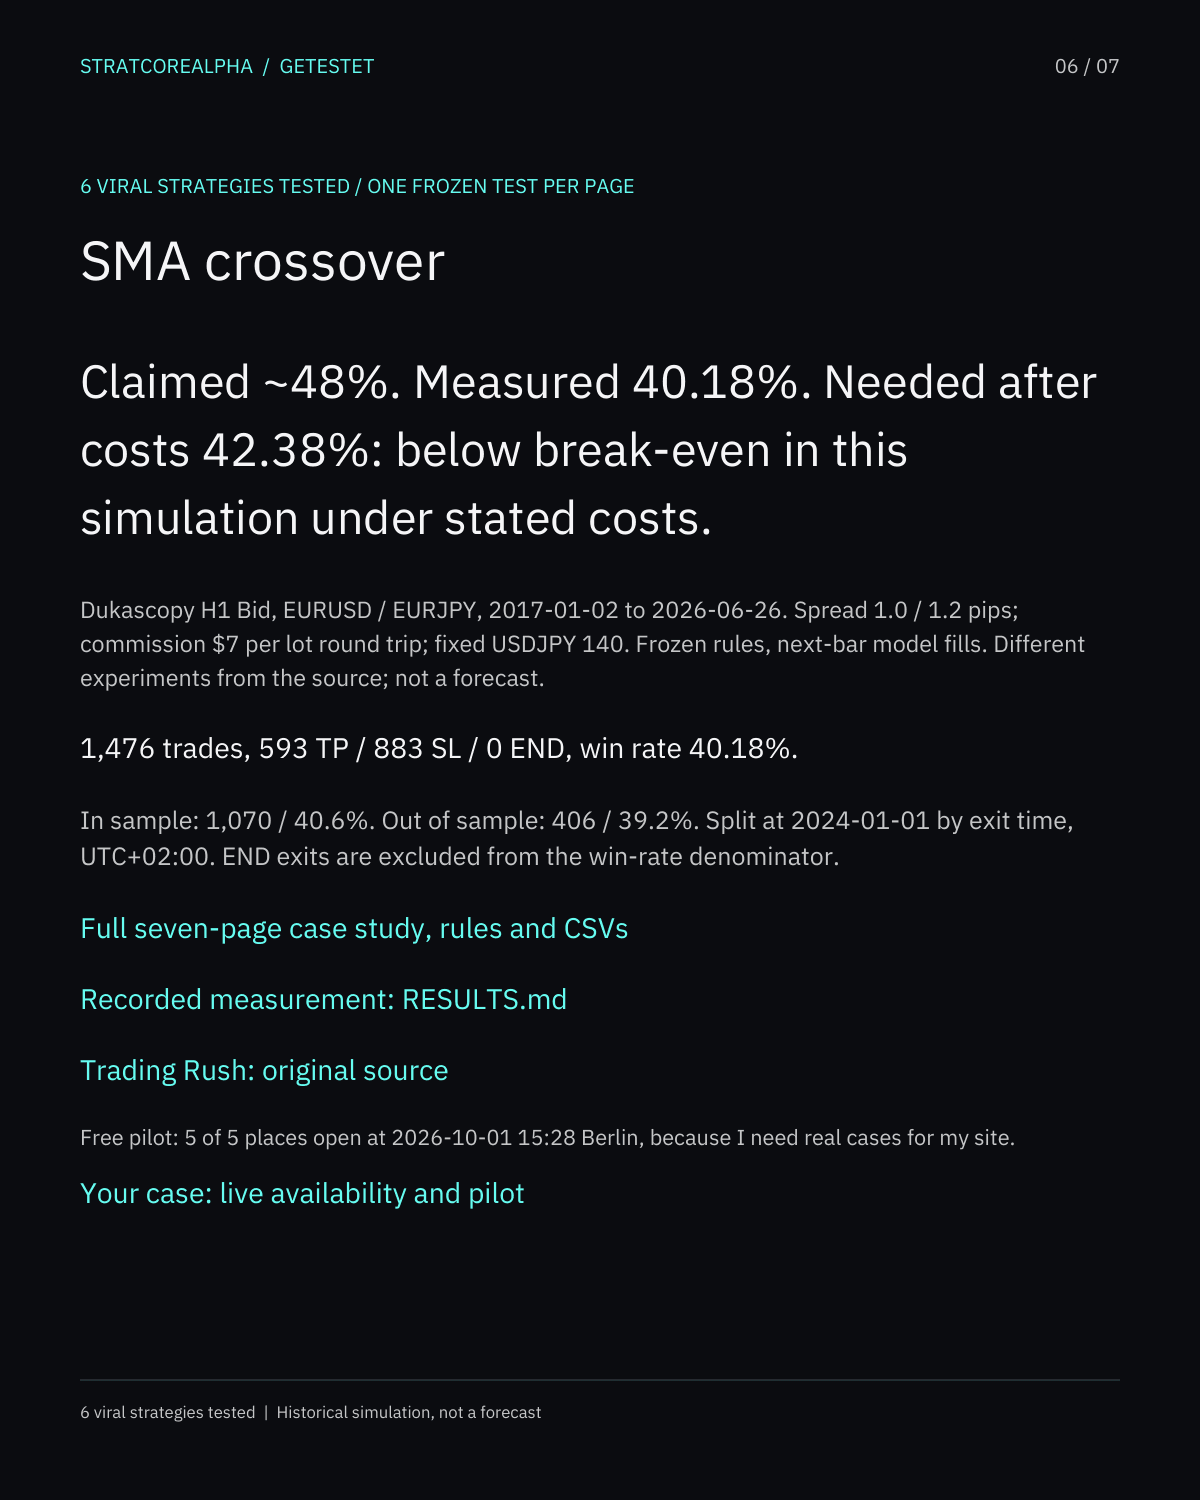
| SMA crossover | ~48% | 40.18% | 42.38% | below break-even |
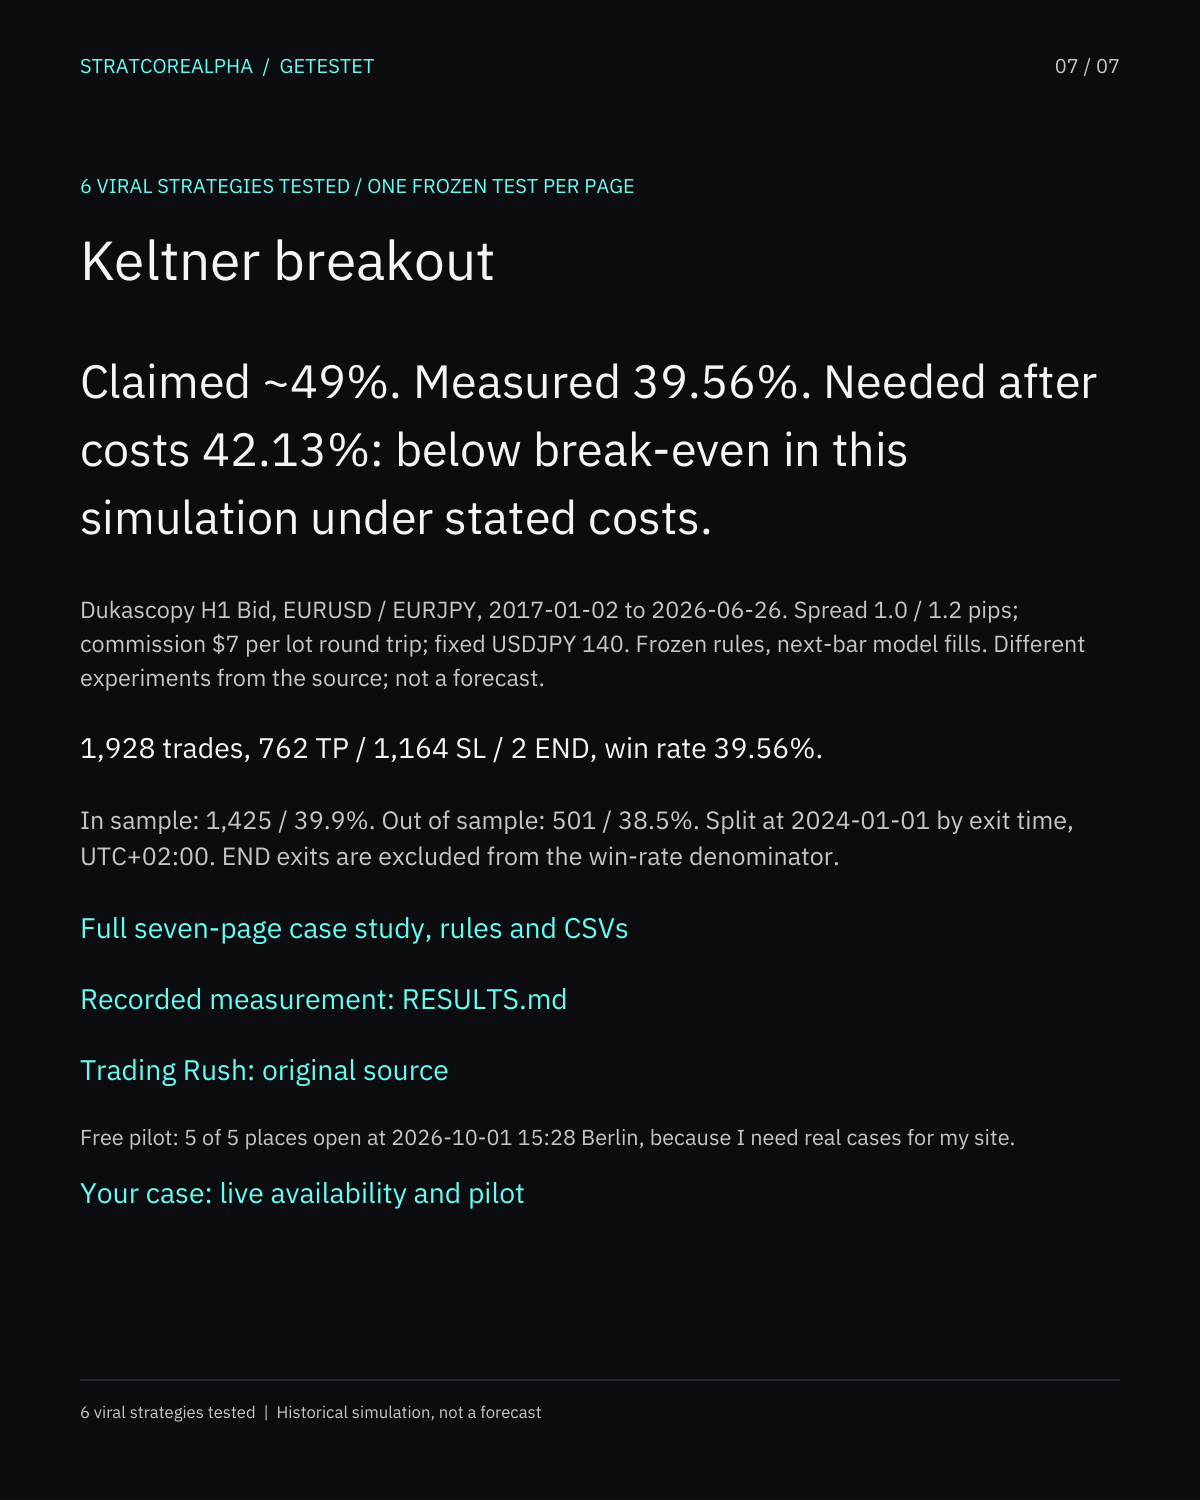
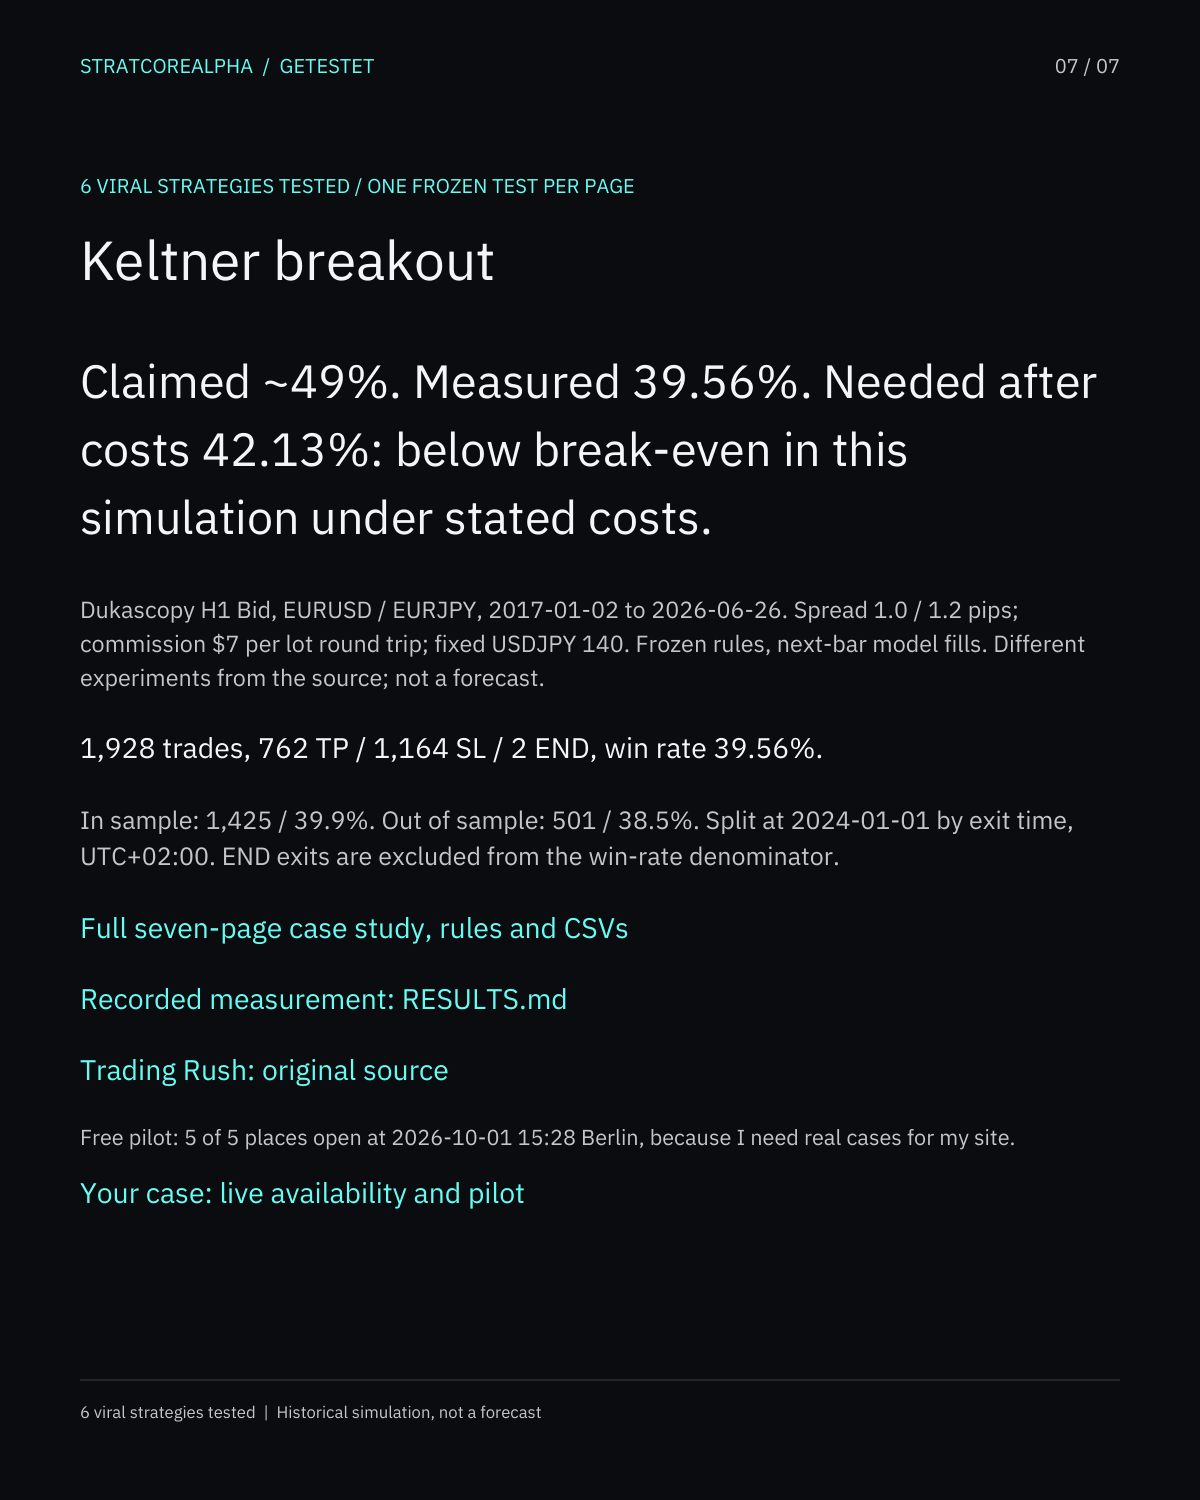
| Keltner breakout | ~49% | 39.56% | 42.13% | below break-even |
Each row links its recorded RESULTS.md. Source and frozen tests are different experiments, not a judgment about an author. No future trading result is implied.
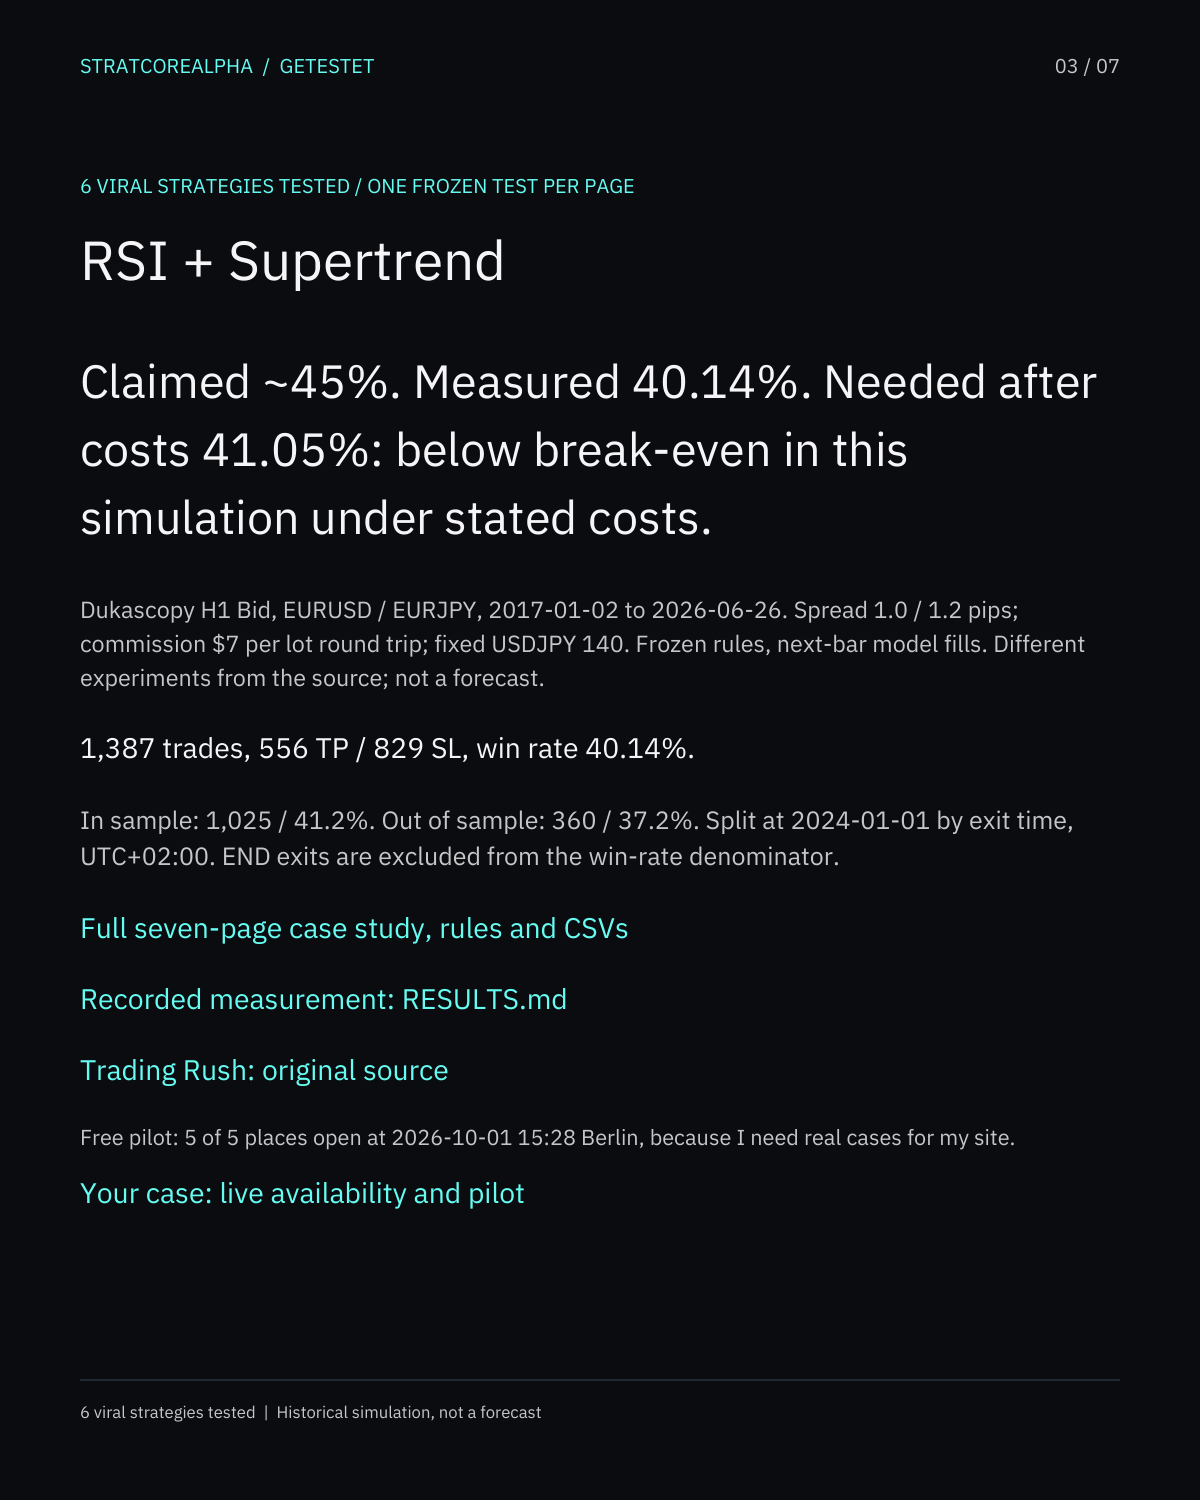
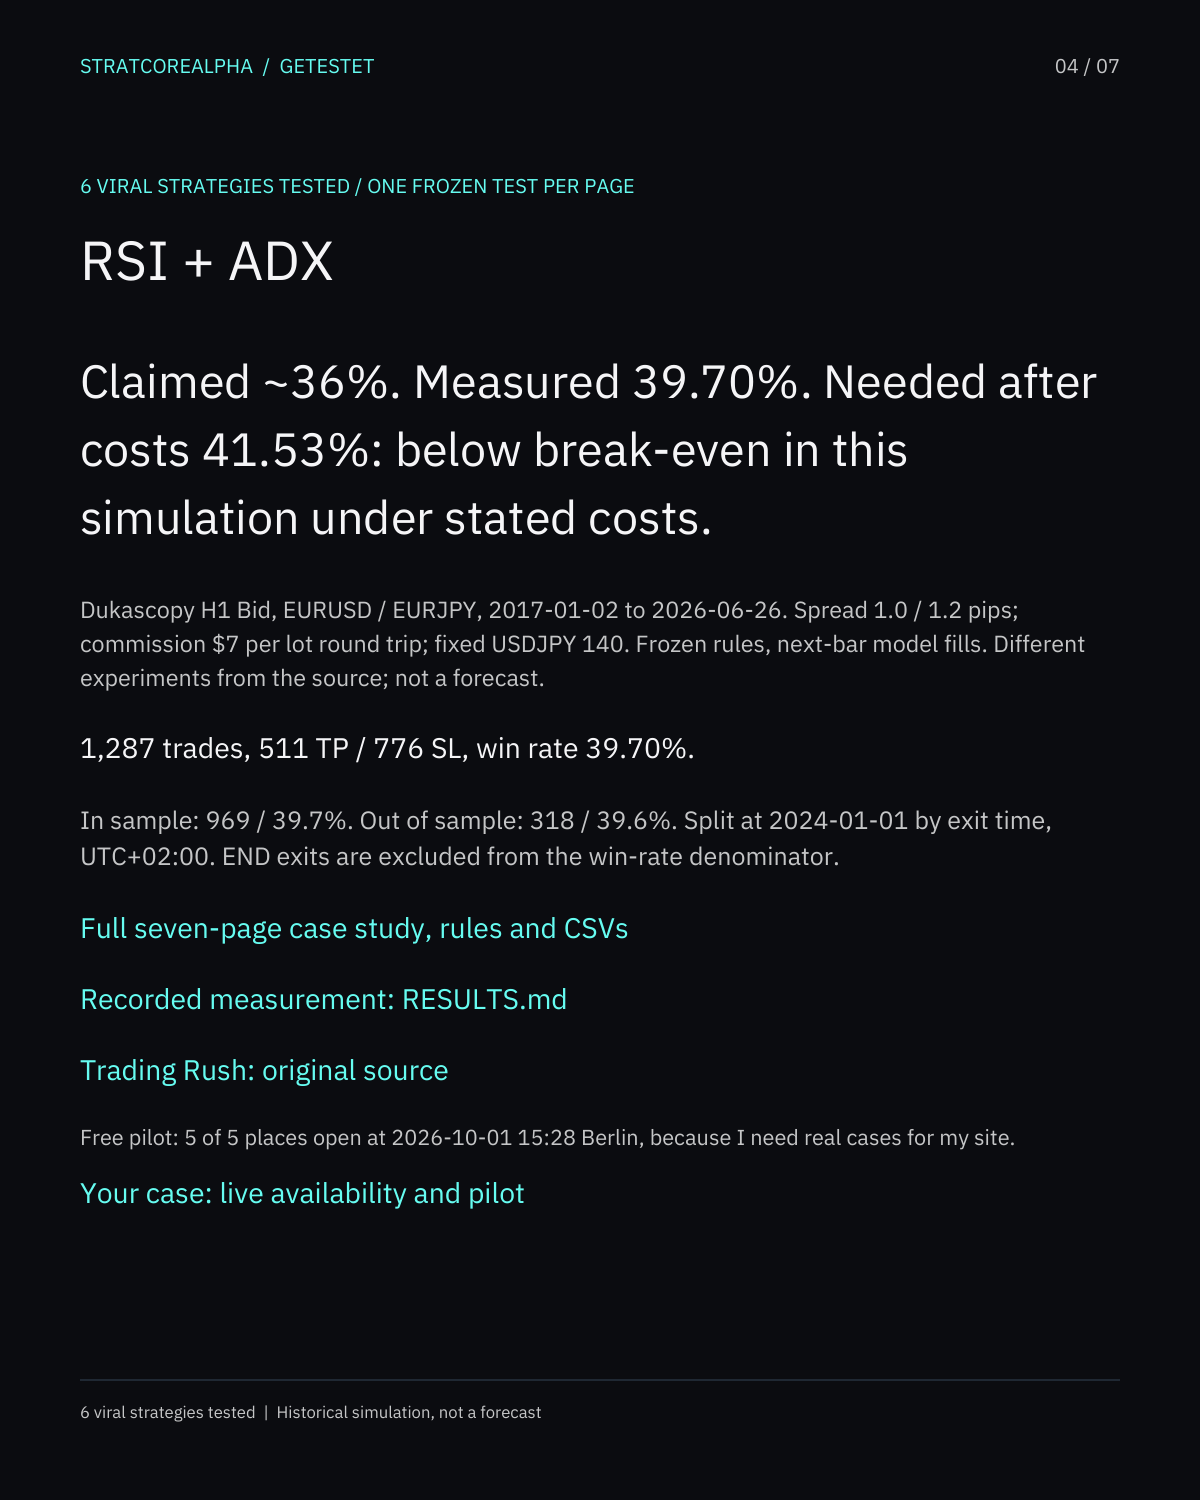
Dukascopy H1 Bid, EURUSD and EURJPY, 2017-01-02 to 2026-06-26. Fixed spreads: 1.0 and 1.2 pips. Commission: $7 per lot round trip. EURJPY conversion: fixed USDJPY 140. Out-of-sample exits begin at 2024-01-01, UTC+02:00. Next-bar model fills are not observed broker execution or a forecast.
I take 5 cases free because I need real cases for my site. Loading the live number of places.
Send your EA, a video or your notesEligible MT5 challenge cases, direct free tier and written feedback within seven days. Submitting does not reserve a place; marketplace contacts stay on their marketplace.
No email gate
Seven pages as a PDF and as separate PNGs. Each test page links its source, full case study and recorded RESULTS.md.
Claimed ~46%. Measured 40.04%. Needed after costs 41.10%: below break-even in this simulation under stated costs.
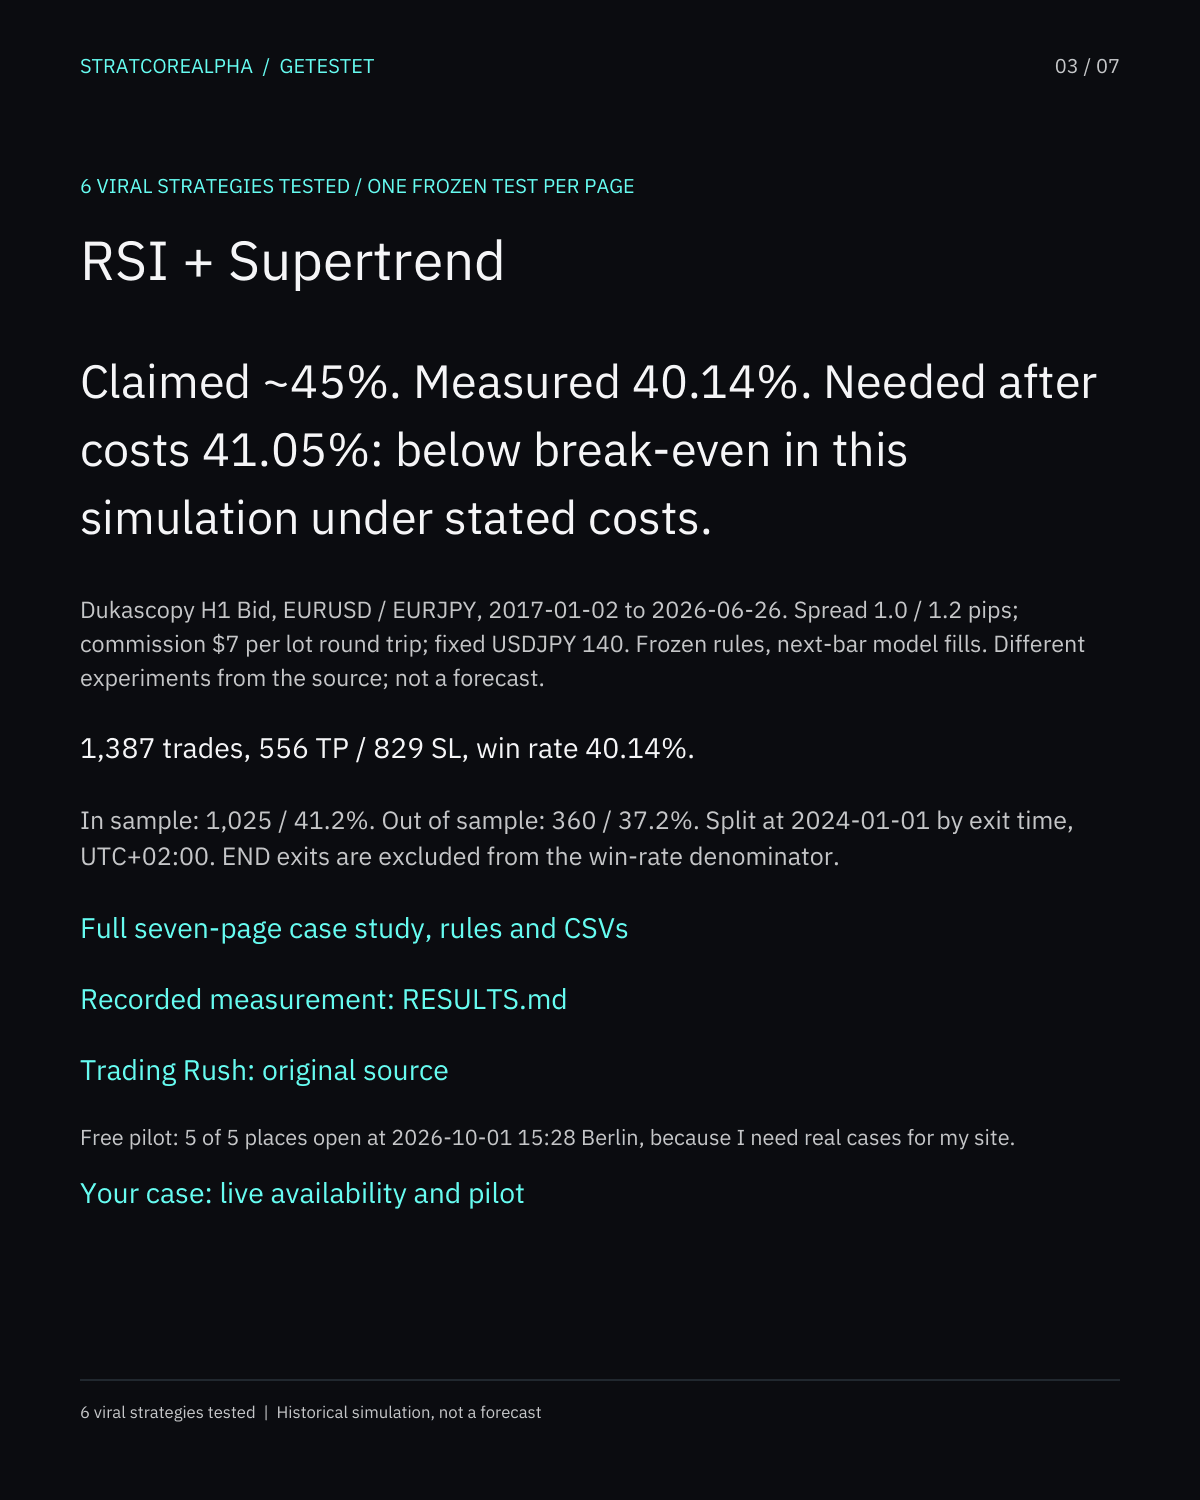
Claimed ~45%. Measured 40.14%. Needed after costs 41.05%: below break-even in this simulation under stated costs.
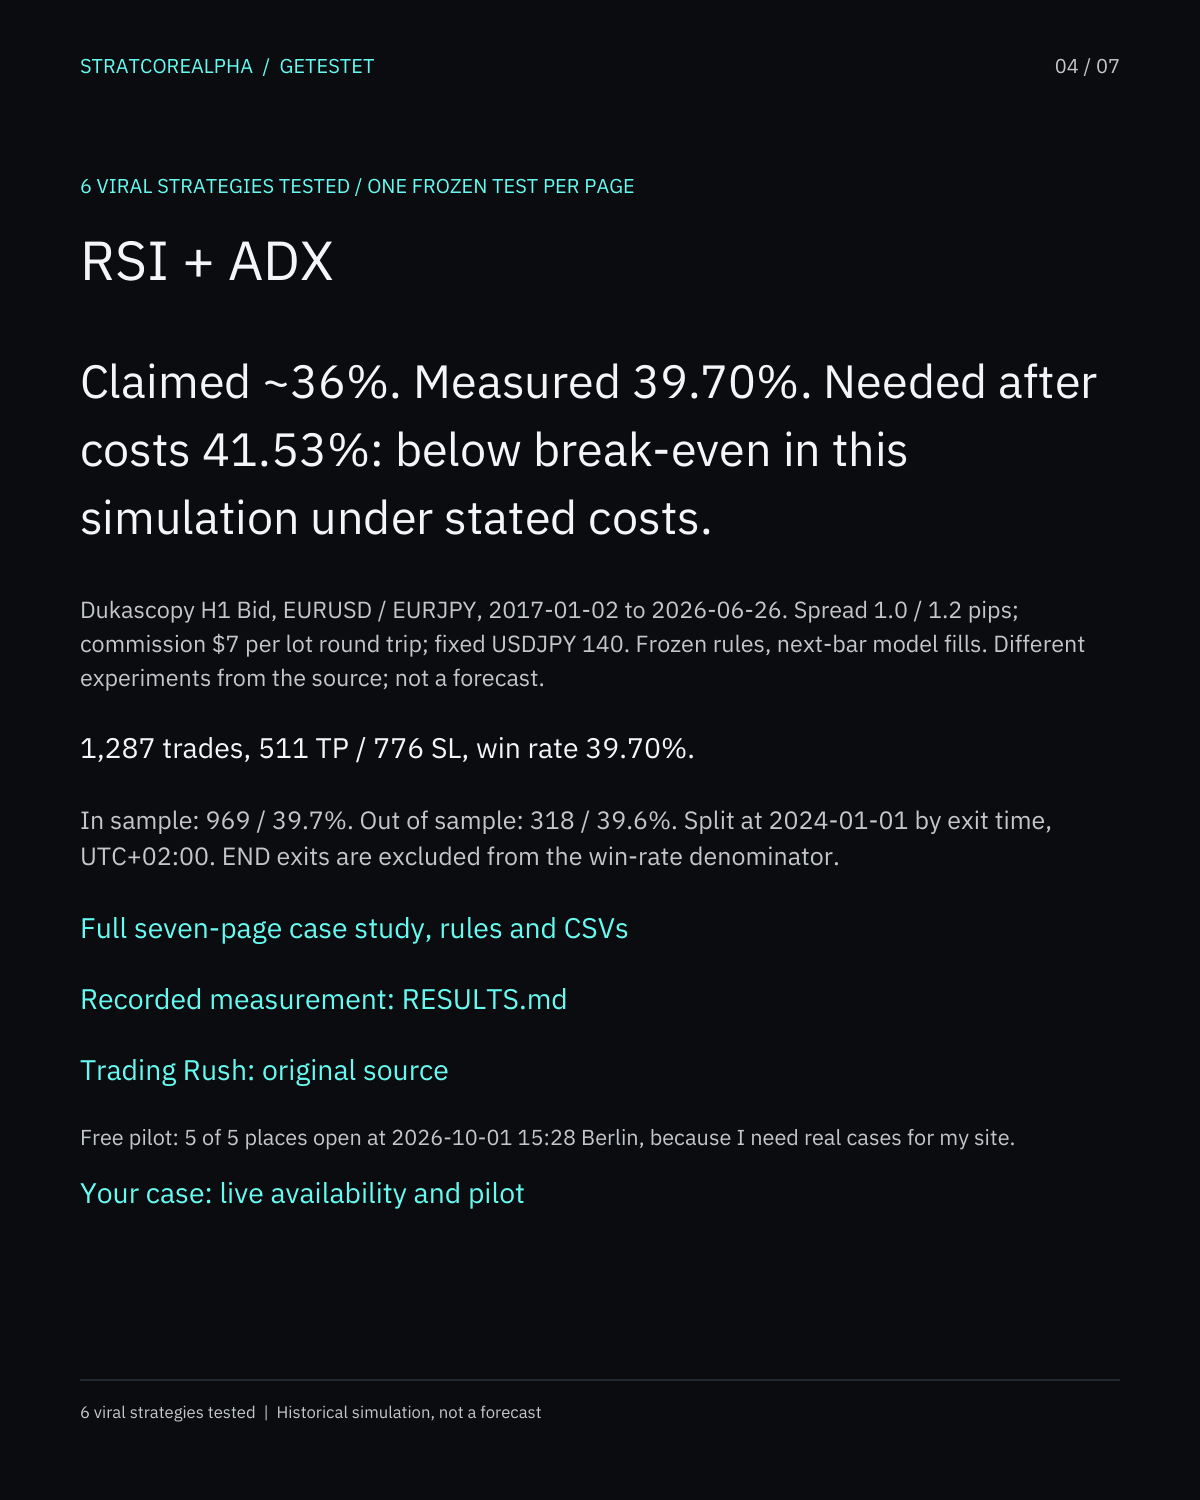
Claimed ~36%. Measured 39.70%. Needed after costs 41.53%: below break-even in this simulation under stated costs.
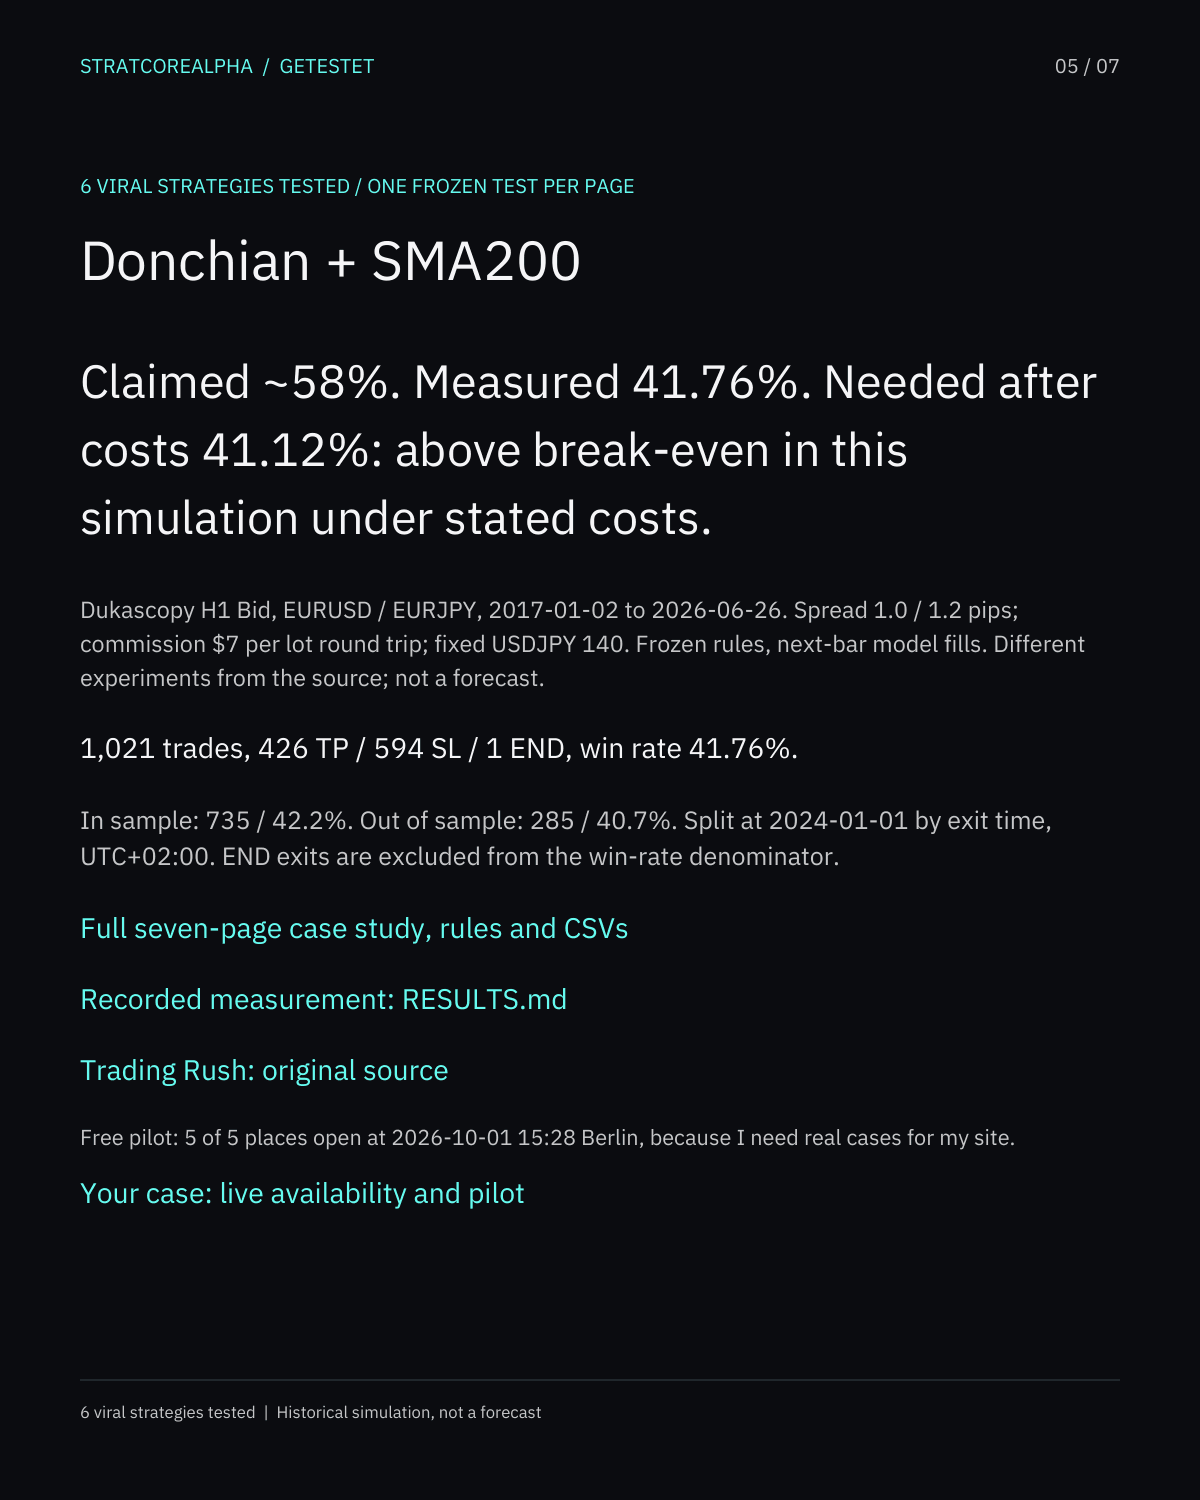
Claimed ~58%. Measured 41.76%. Needed after costs 41.12%: above break-even in this simulation under stated costs.
Claimed ~48%. Measured 40.18%. Needed after costs 42.38%: below break-even in this simulation under stated costs.
Claimed ~49%. Measured 39.56%. Needed after costs 42.13%: below break-even in this simulation under stated costs.
Futures and forex trading contains substantial risk and is not for every investor. An investor could potentially lose all or more than the initial investment. Risk capital is money that can be lost without jeopardizing one's financial security or lifestyle. Only risk capital should be used for trading, and only those with sufficient risk capital should consider trading. Past performance is not necessarily indicative of future results.
Hypothetical performance results have many inherent limitations. No representation is being made that any account will or is likely to achieve profits or losses similar to those shown. There are frequently sharp differences between hypothetical performance results and the actual results subsequently achieved by any particular trading program. Hypothetical results are generally prepared with the benefit of hindsight, do not involve financial risk, and cannot completely account for the impact of financial risk in actual trading. Market conditions, the ability to withstand losses, and adherence to a trading program can all materially affect actual results.
NinjaTrader® is a registered trademark of NinjaTrader Group, LLC. No NinjaTrader company has any affiliation with the owner, developer, or provider of the products or services described herein, or any interest, ownership or otherwise, in any such product or service, or endorses, recommends or approves any such product or service.
Testimonials, when shown, may not represent the experience of other clients and are not a guarantee of future performance or success. Virtual-currency trading carries additional risks. See the CFTC customer advisories. Read the full financial risk disclaimer.