Getestet · W7-TEST · Historical simulation
A higher win rate did not settle the RSI and ADX claim
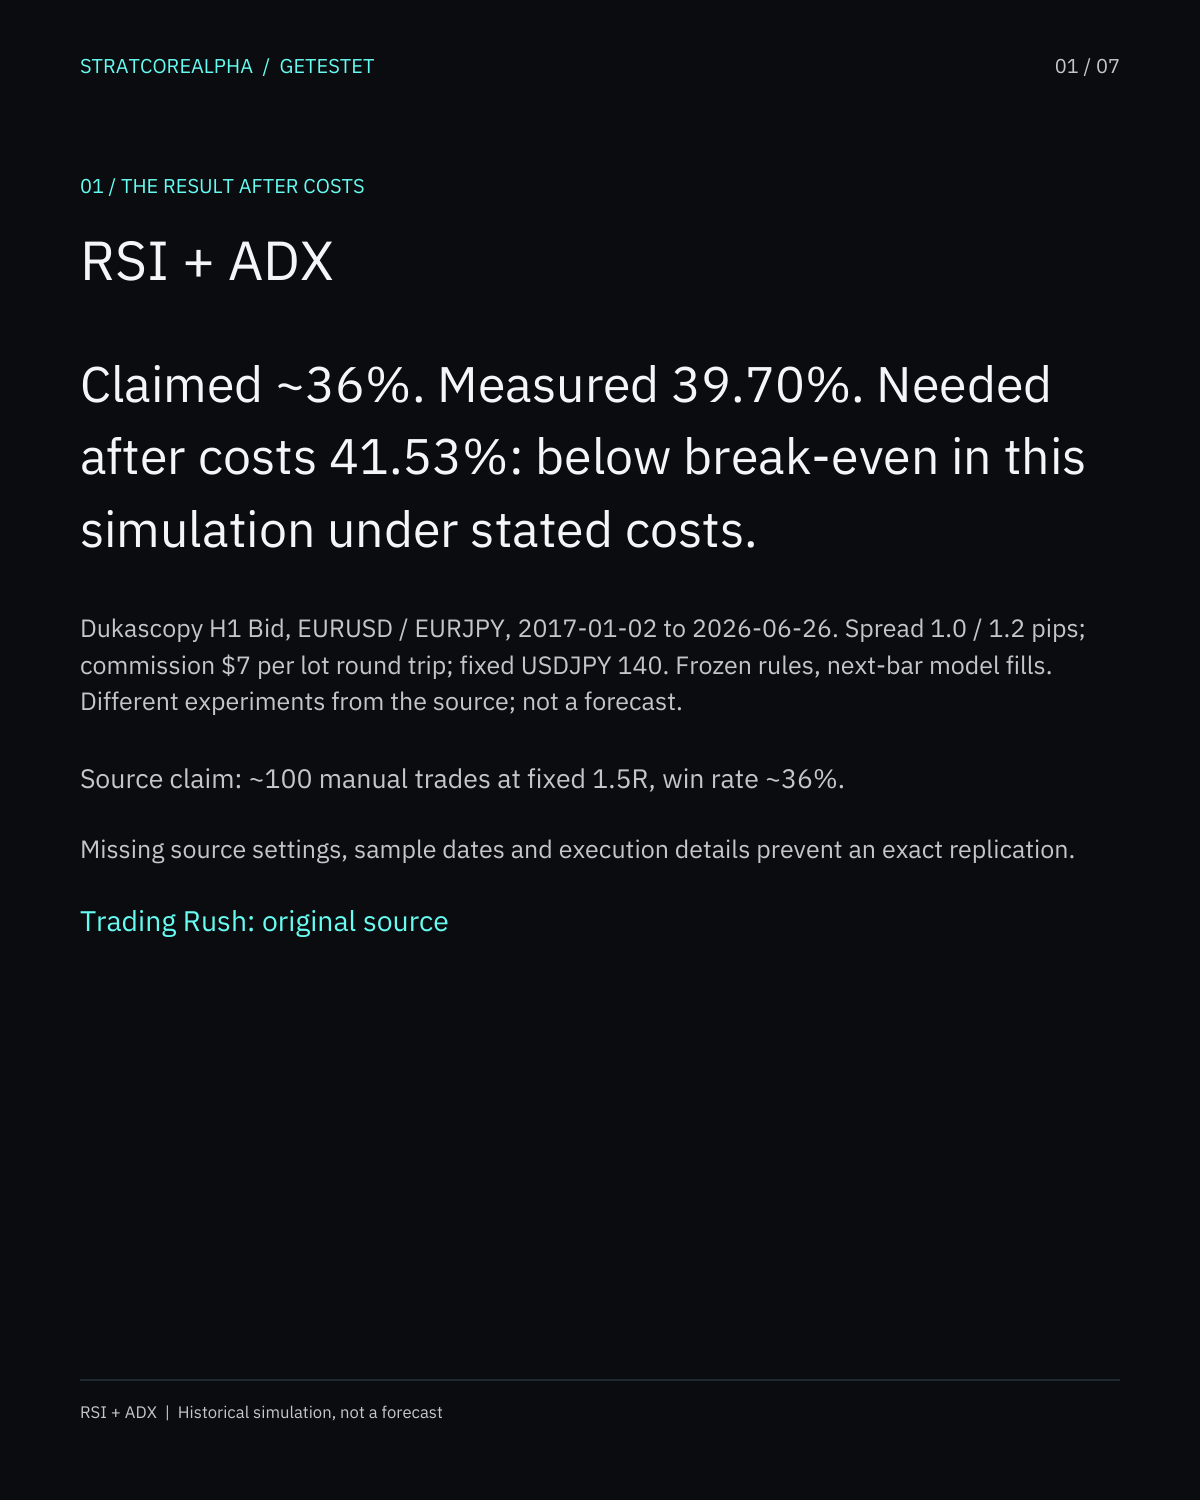
Claimed ~36%. Measured 39.70%. Needed after costs 41.53%: below break-even in this simulation under stated costs.
Measured under the frozen rules
39.70%1,287 trades, 511 TP / 776 SL, win rate 39.70%.
The source and this run are different experiments. Missing settings and sample details prevent an exact replication. Model fills are not observed broker execution. No profit or challenge-pass claim.
Trading Rush described an RSI and ADX strategy with a reported win rate near 36% after about 100 manual trades. I tested one fully specified version over a longer continuous dataset. It measured 39.70% wins in 1,287 trades across EURUSD and EURJPY H1. That is higher than the video's headline. It still does not answer the important question on its own: was the rate high enough for the chosen reward, risk and modeled costs?
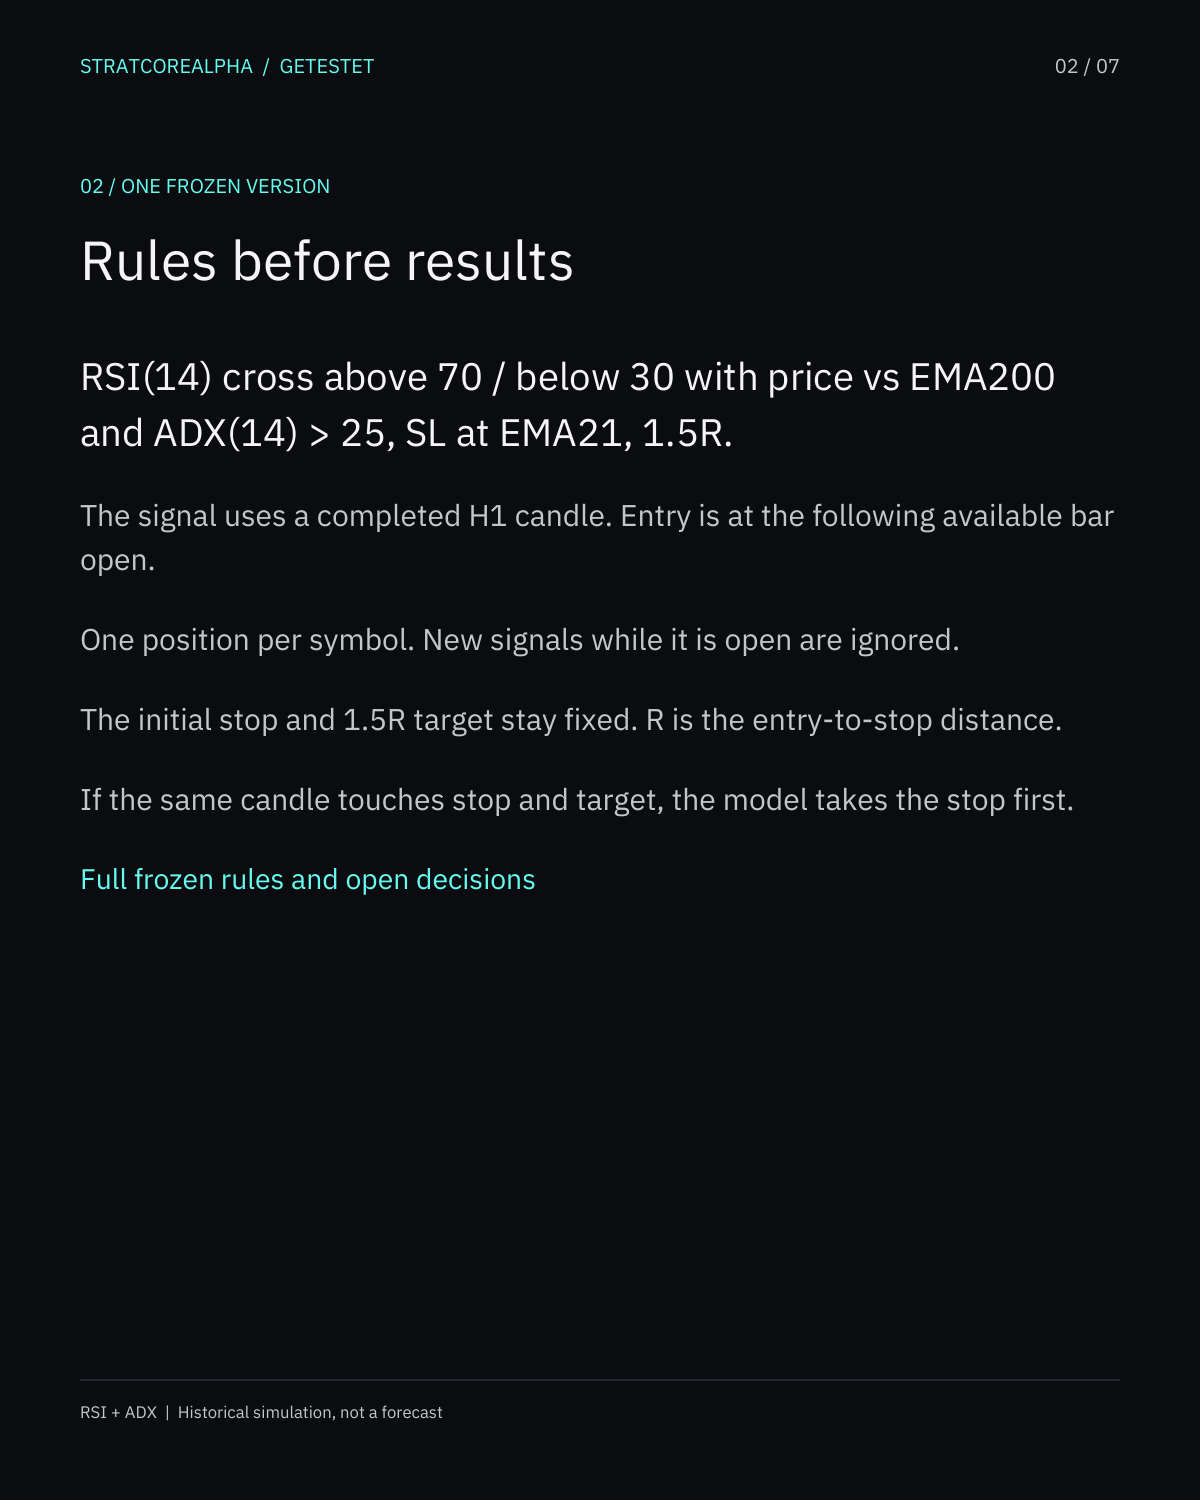
RSI measures momentum. ADX measures trend strength but does not say which direction the trend runs. A complete entry needs both the RSI event and a direction rule. I used RSI(14) crossing 70 for long or 30 for short on a finished hourly candle, ADX(14) above 25, and price on the matching side of EMA200. The modeled entry is at the next hour's open. I fixed the stop at EMA21 on the signal bar and the target at 1.5 times the initial risk. These are recorded in the rule sheet. Some settings had to be frozen because the source did not specify every execution detail.
The data are official Dukascopy hourly Bid candles, 2 January 2017 through 26 June 2026. I used the full available history for both EURUSD and EURJPY. I declared 1 January 2024 as the boundary before running the test. Trades exiting before then are in sample; later exits are out of sample. That prevents a favorable later period from being chosen after seeing the answer.
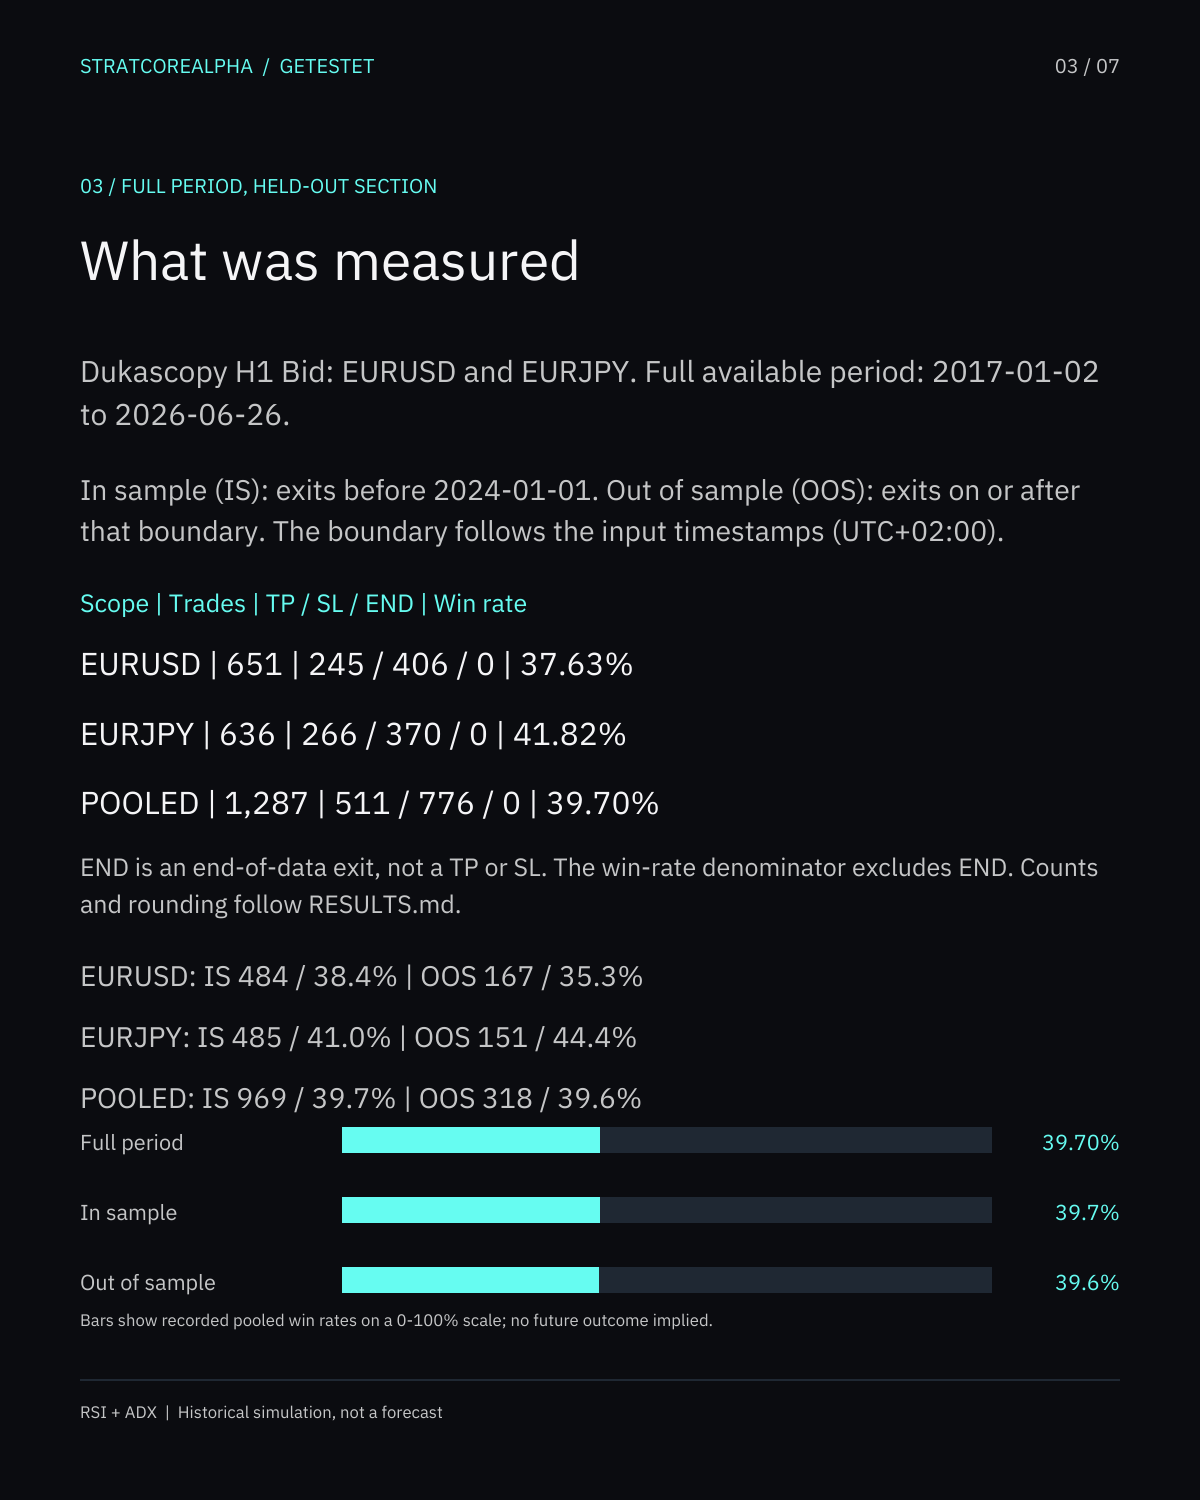
The pooled base run had 511 target exits and 776 stop exits. EURUSD measured 37.63% wins over 651 trades; EURJPY measured 41.82% over 636. The in-sample rate was 39.7% over 969 trades. The out-of-sample rate was 39.6% over 318. This near-flat split does not prove future stability. It says only that the win-rate count in these two historical sections happened to be similar.
Why the higher number is not the conclusion
At a 1.5R target, a rough breakeven intuition before costs is two wins in five trades. The exact trade-level calculation in the result sheet includes fixed costs and the modeled reward-to-risk actually achieved. I assumed a 1.0-pip EURUSD spread, a 1.2-pip EURJPY spread, and $7 per standard lot round-trip commission. I used a fixed USDJPY 140 to convert the EURJPY commission. Bid candles do not contain the actual Ask prices or historical broker charges; those amounts are assumptions, not observed fills.
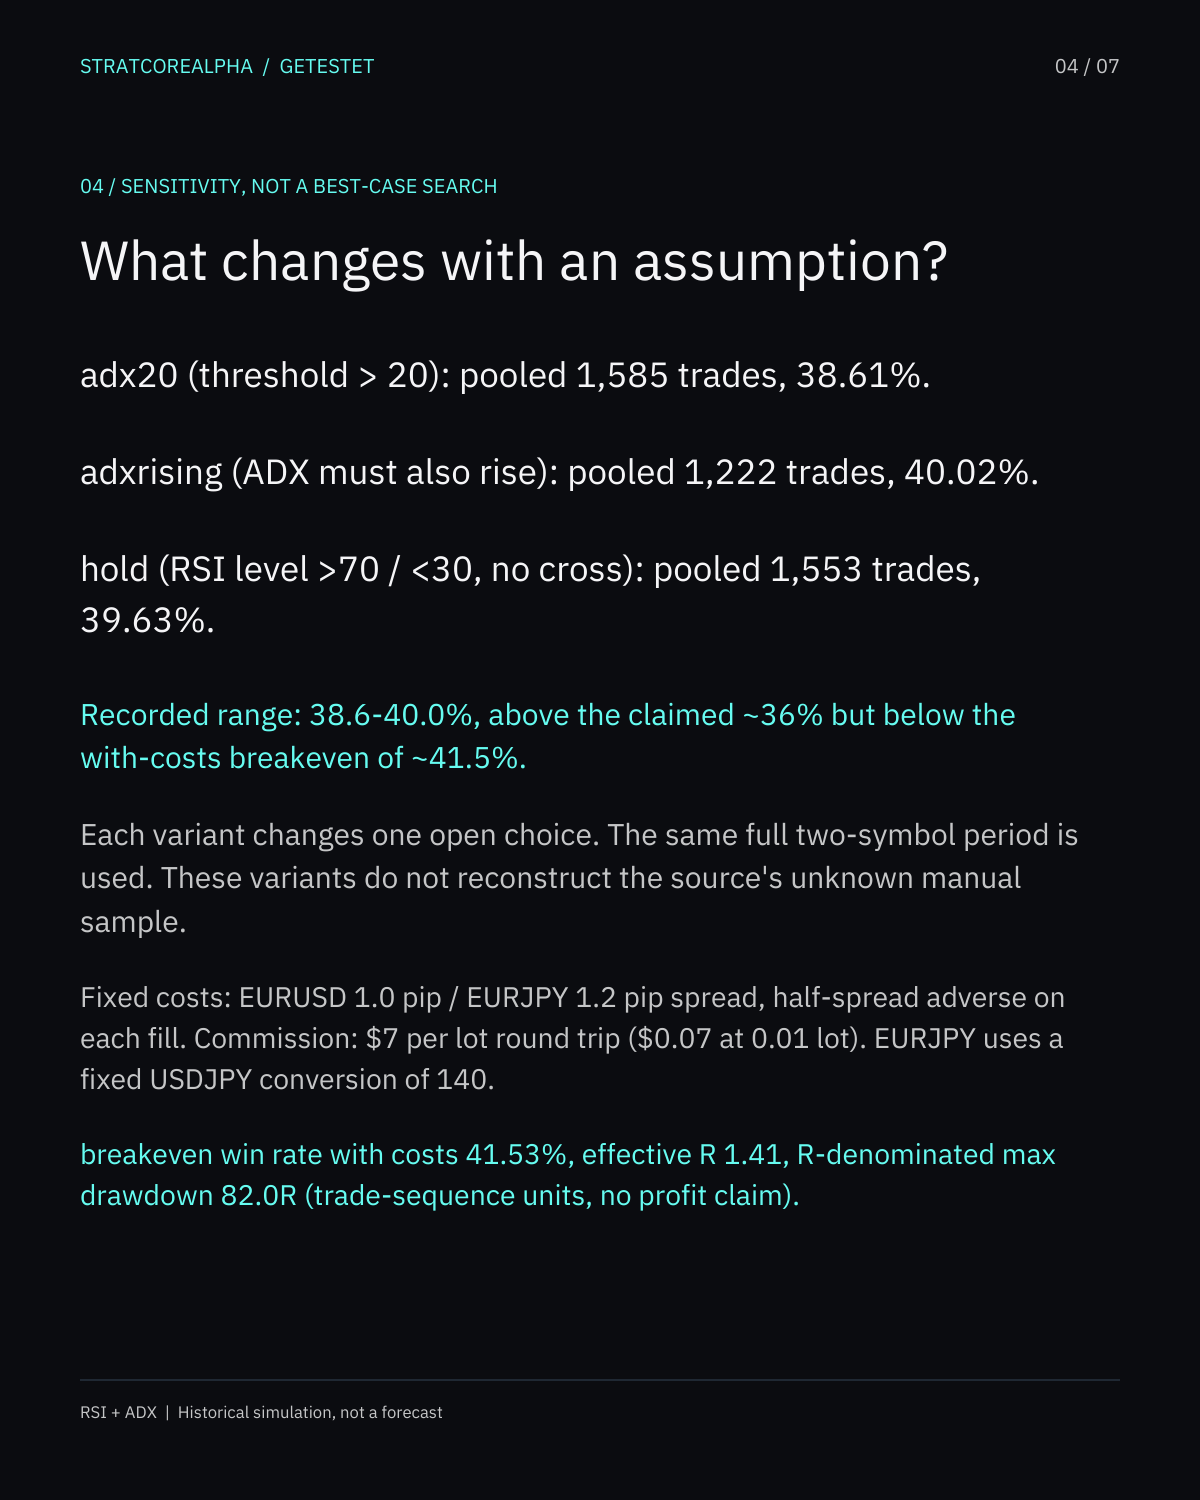
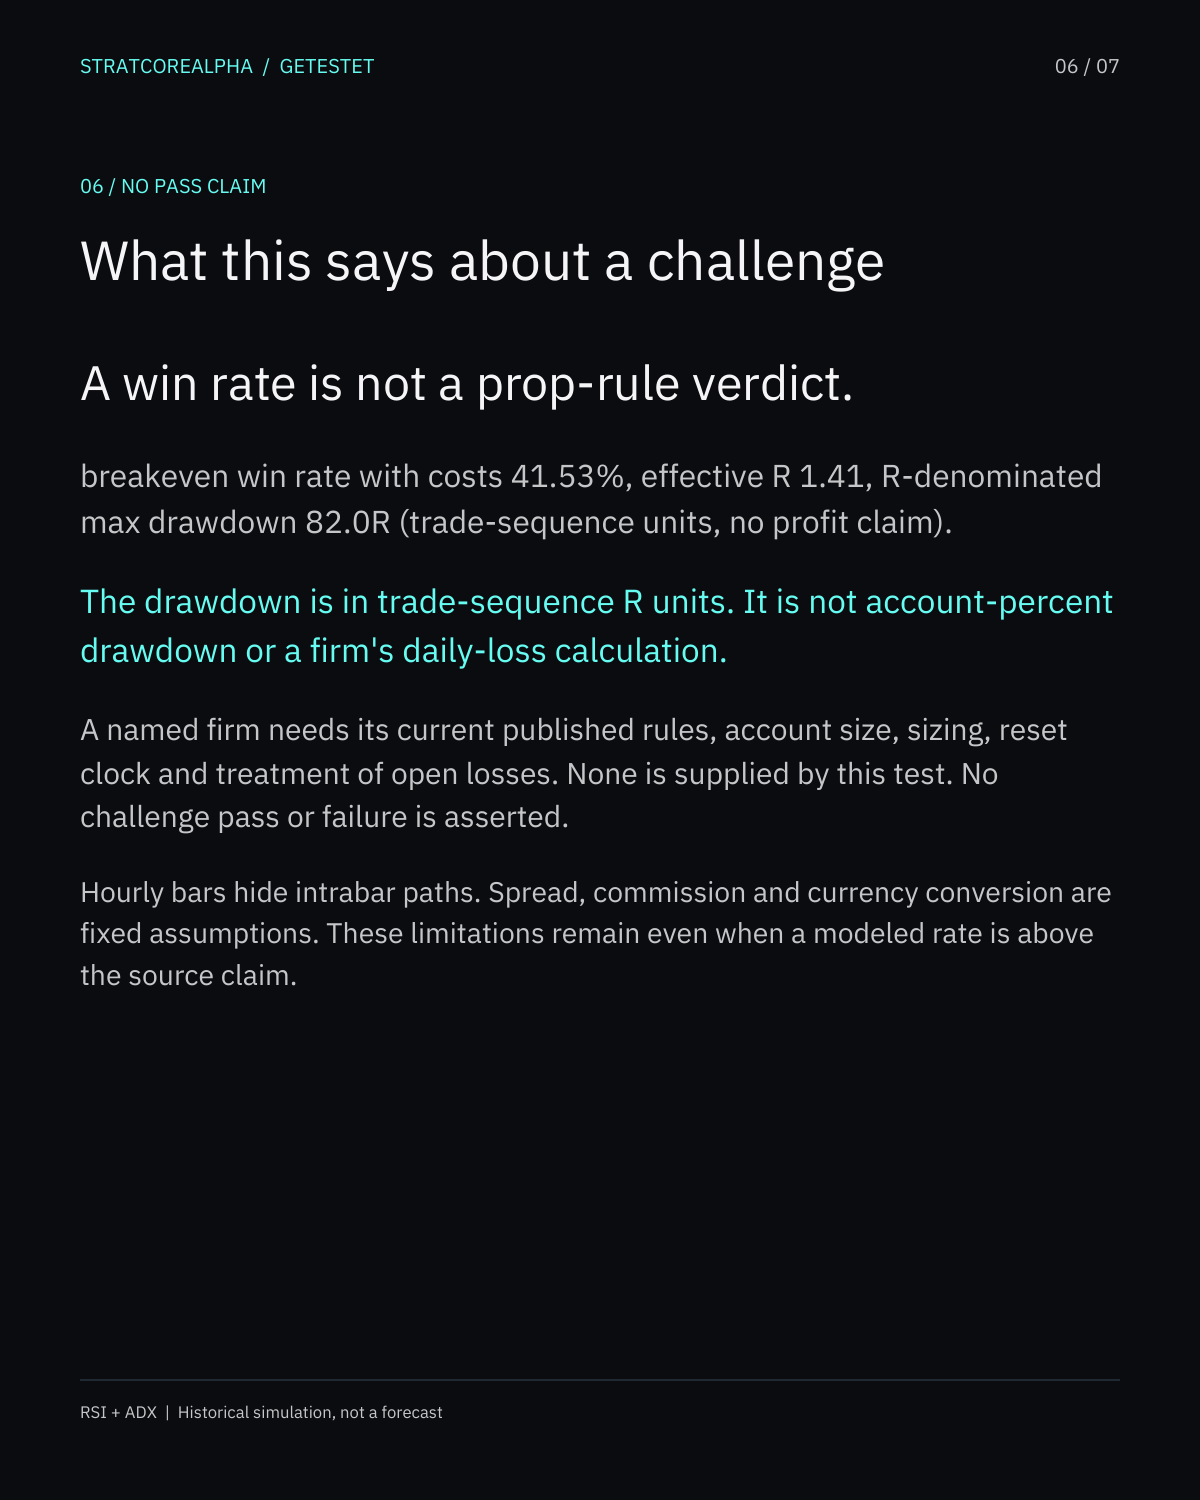
With those assumptions the pooled effective reward-to-risk was 1.41 and the win rate needed to break even was 41.53%. The measured base rate, 39.70%, fell short even though it exceeded the video's approximate 36%. The modeled trade sequence had an 82.0R maximum drawdown. That number is a historical risk measure in units of the initial stop distance, not an account result or a promise of what will happen next.
Three single-choice variants show how open rules matter. Lowering the ADX threshold to 20 produced 38.61% wins over 1,585 trades. Requiring ADX to rise as well as exceed 25 produced 40.02% over 1,222. Treating RSI as a continuing state beyond 70 or 30, instead of a fresh crossing, produced 39.63% over 1,553. The range was 38.6% to 40.0%. None met the base run's with-cost breakeven rate, though each variant would need its own cost calculation before making a detailed comparison.
Three acceptance cases
First, put an example candle just above EMA200 with ADX exactly 25. The frozen rule uses strictly greater than 25, so that bar should not trigger. A developer and reviewer can check one simple boundary instead of arguing about a chart later.
Second, use an RSI sequence that crosses the threshold only once but remains beyond it for two more bars. The base crossing rule should not produce three fresh entries. The threshold-state variant is a separate test, not a silent implementation choice.
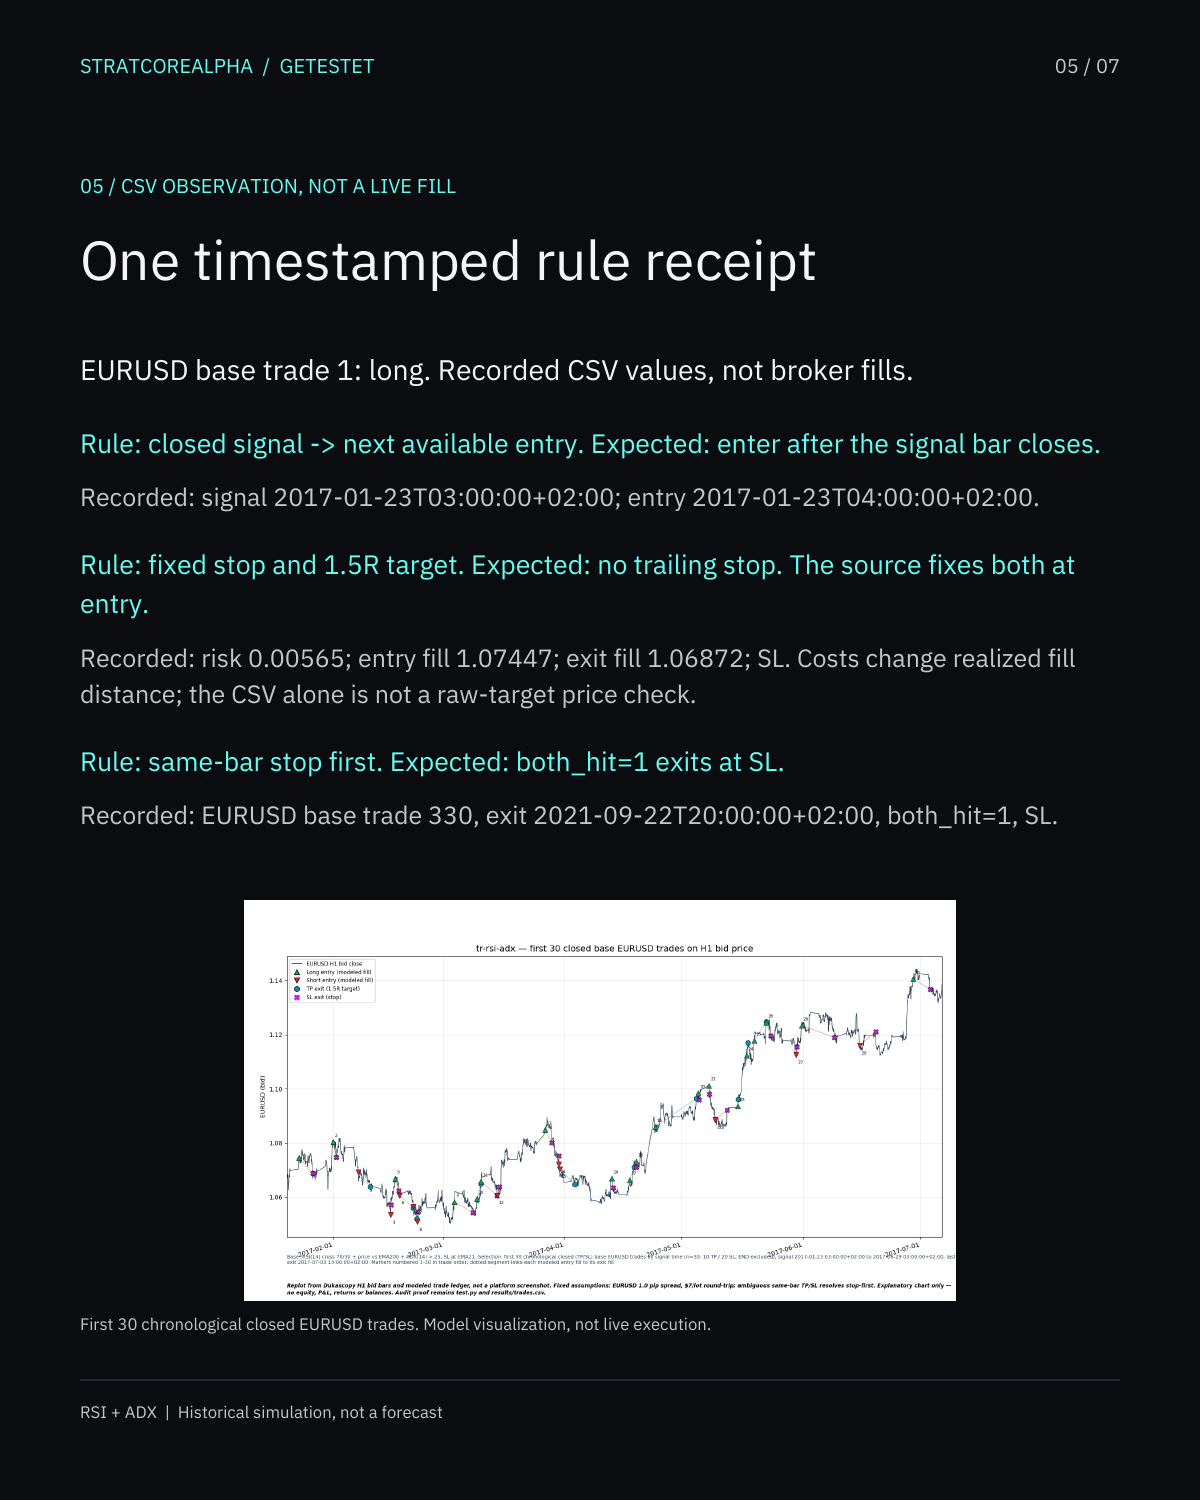
Third, supply an hourly candle whose high and low cross both the target and stop. OHLC bars cannot identify the intrabar order. The run chooses the stop first, and one base trade was affected. A tick-level replay might answer that case differently. The model should disclose its policy rather than present it as a confirmed fill.
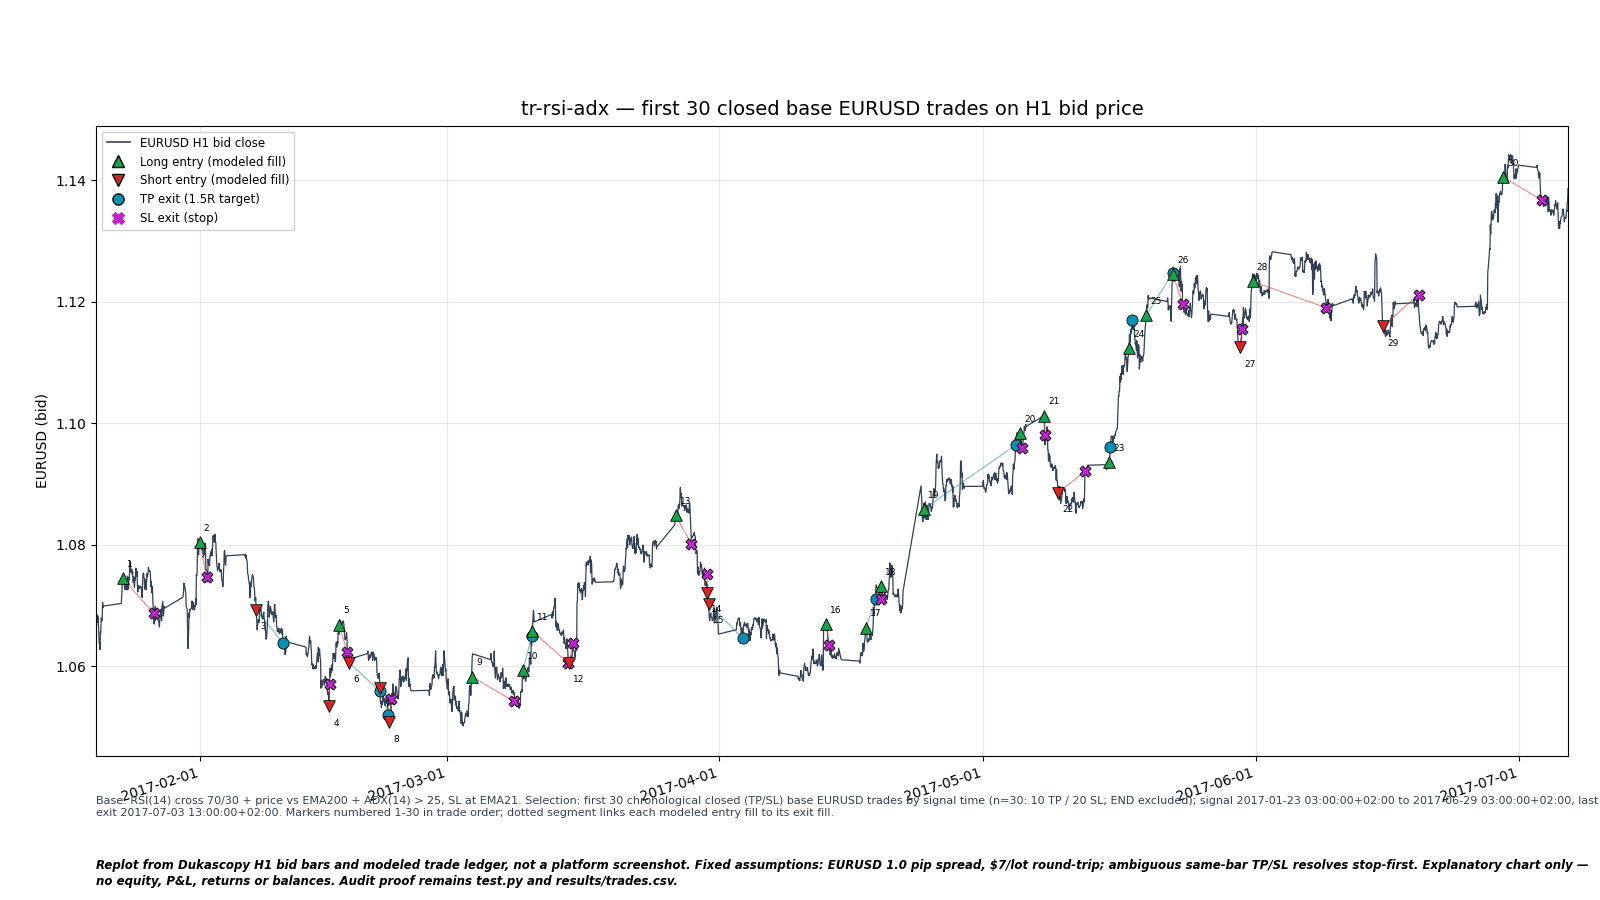
The script and per-trade CSV allow the counts to be checked. The companion figure uses the first 30 chronological EURUSD trades to explain the markers, not a favorable selection. This is not an exact replication of the manual video test and does not show a live result or any prop-firm compliance.
When someone says a strategy “wins 40% of trades,” ask for the reward-to-risk after costs and the rule that decides every entry. The rule check is a way to freeze those choices before a historical test. A rate by itself is only one column of the result.
The recorded result
Full period and held-out trades
Dukascopy H1 Bid, 2017-01-02 to 2026-06-26. Split by exit timestamp at 2024-01-01 in the input timezone (UTC+02:00). END is an end-of-data exit and is excluded from the TP/SL win-rate denominator.
| Scope | Trades | TP | SL | END | Win rate | IS (n/rate) | OOS (n/rate) |
|---|---|---|---|---|---|---|---|
| EURUSD | 651 | 245 | 406 | 0 | 37.63% | 484 / 38.4% | 167 / 35.3% |
| EURJPY | 636 | 266 | 370 | 0 | 41.82% | 485 / 41.0% | 151 / 44.4% |
| POOLED | 1,287 | 511 | 776 | 0 | 39.70% | 969 / 39.7% | 318 / 39.6% |
Fixed assumptions: EURUSD 1.0 pip and EURJPY 1.2 pips spread; half-spread adverse on every fill. Commission $7 per lot round trip, $0.07 at 0.01 lot. EURJPY conversion uses fixed USDJPY 140. breakeven win rate with costs 41.53%, effective R 1.41, R-denominated max drawdown 82.0R (trade-sequence units, no profit claim).
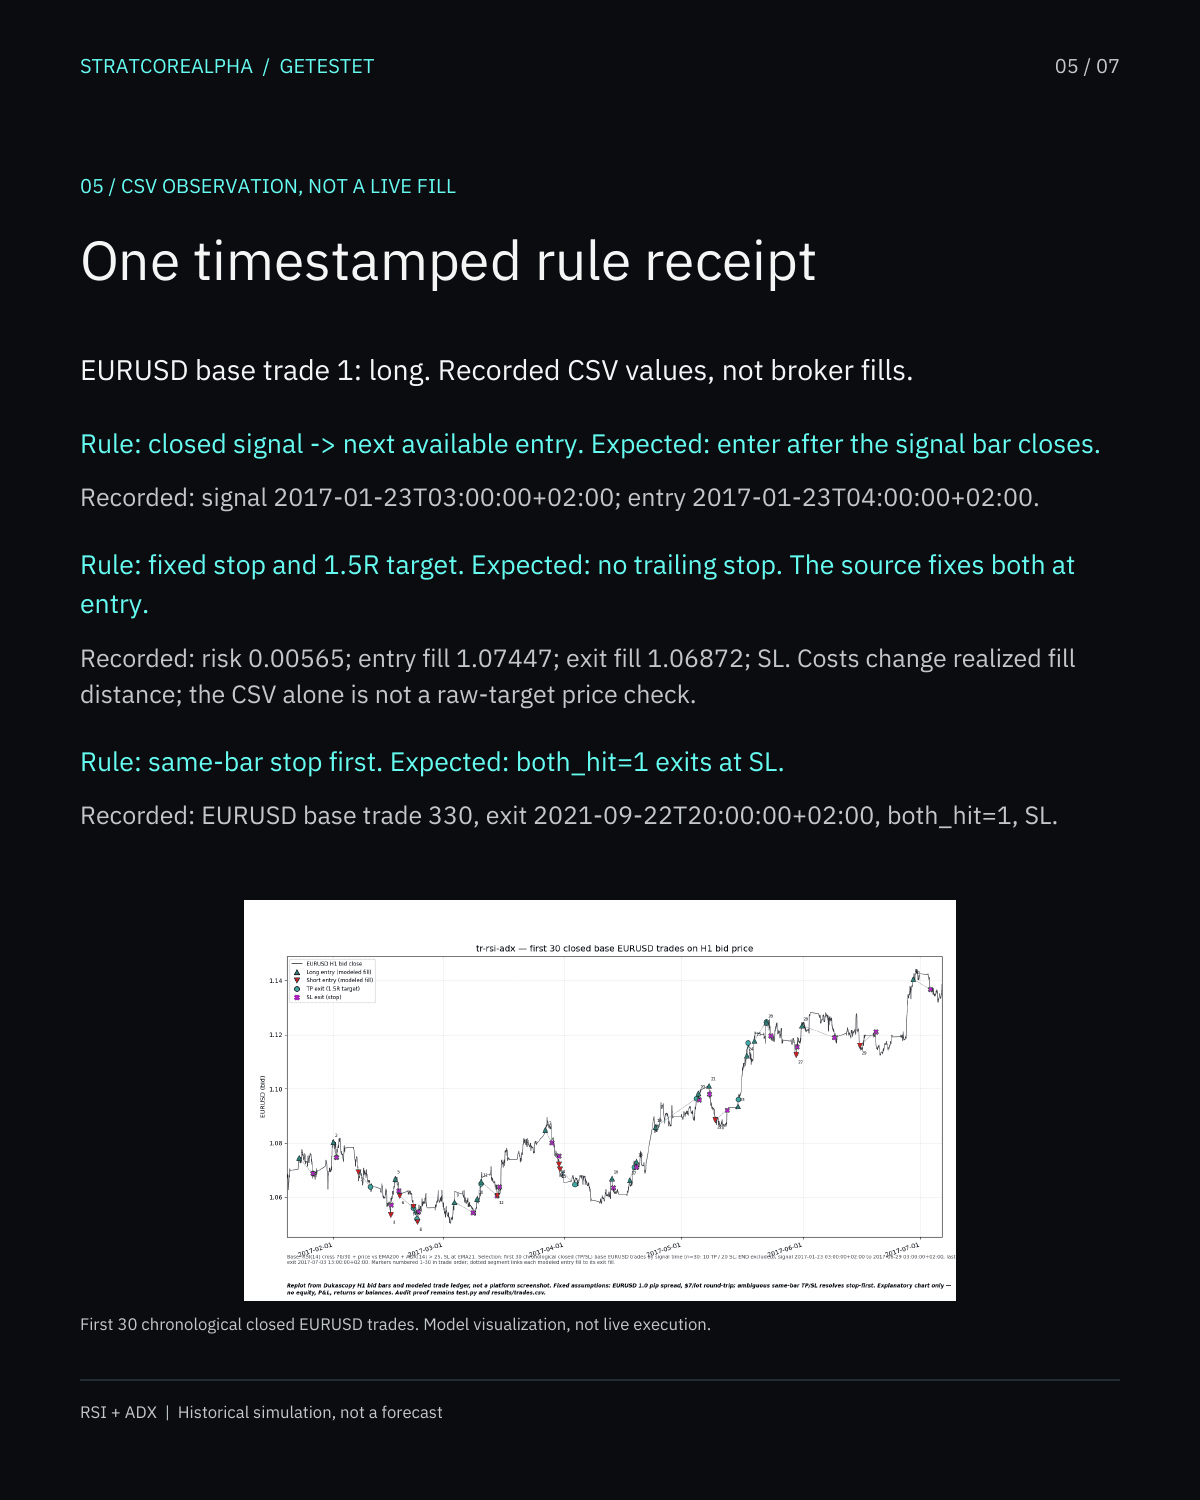
Public rule receipt
Expected rule beside the recorded output
Closed signal and next entry, fixed stop/target, and the same-bar policy. The CSV excerpt names what is observed and what the ledger cannot prove.
No email gate
Seven-page case study and audit files
The PDF and PNG pages share the same content. The CSVs, frozen rules and source code show what was counted. Raw Dukascopy candles are not redistributed.
PNG pages for reading or sharing
Your own case
An EA, a video or notes are enough to start
I write the rules; you confirm them. The direct pilot follows the T99 scope with written feedback within seven days. Current eligibility, allocation and terms are on the pilot page.
I take 5 cases free because I need real cases for my site. Loading the live number of places.
Send your EA, a video or your notesT99 is 99 EUR or USD: one strategy, one symbol, one timeframe, three agreed rule cases, a 12-month historical test and a report with limits. Historical outcomes are not forecasts.