Getestet · W7-TEST · Historical simulation
What an RSI and Supertrend win rate leaves unanswered
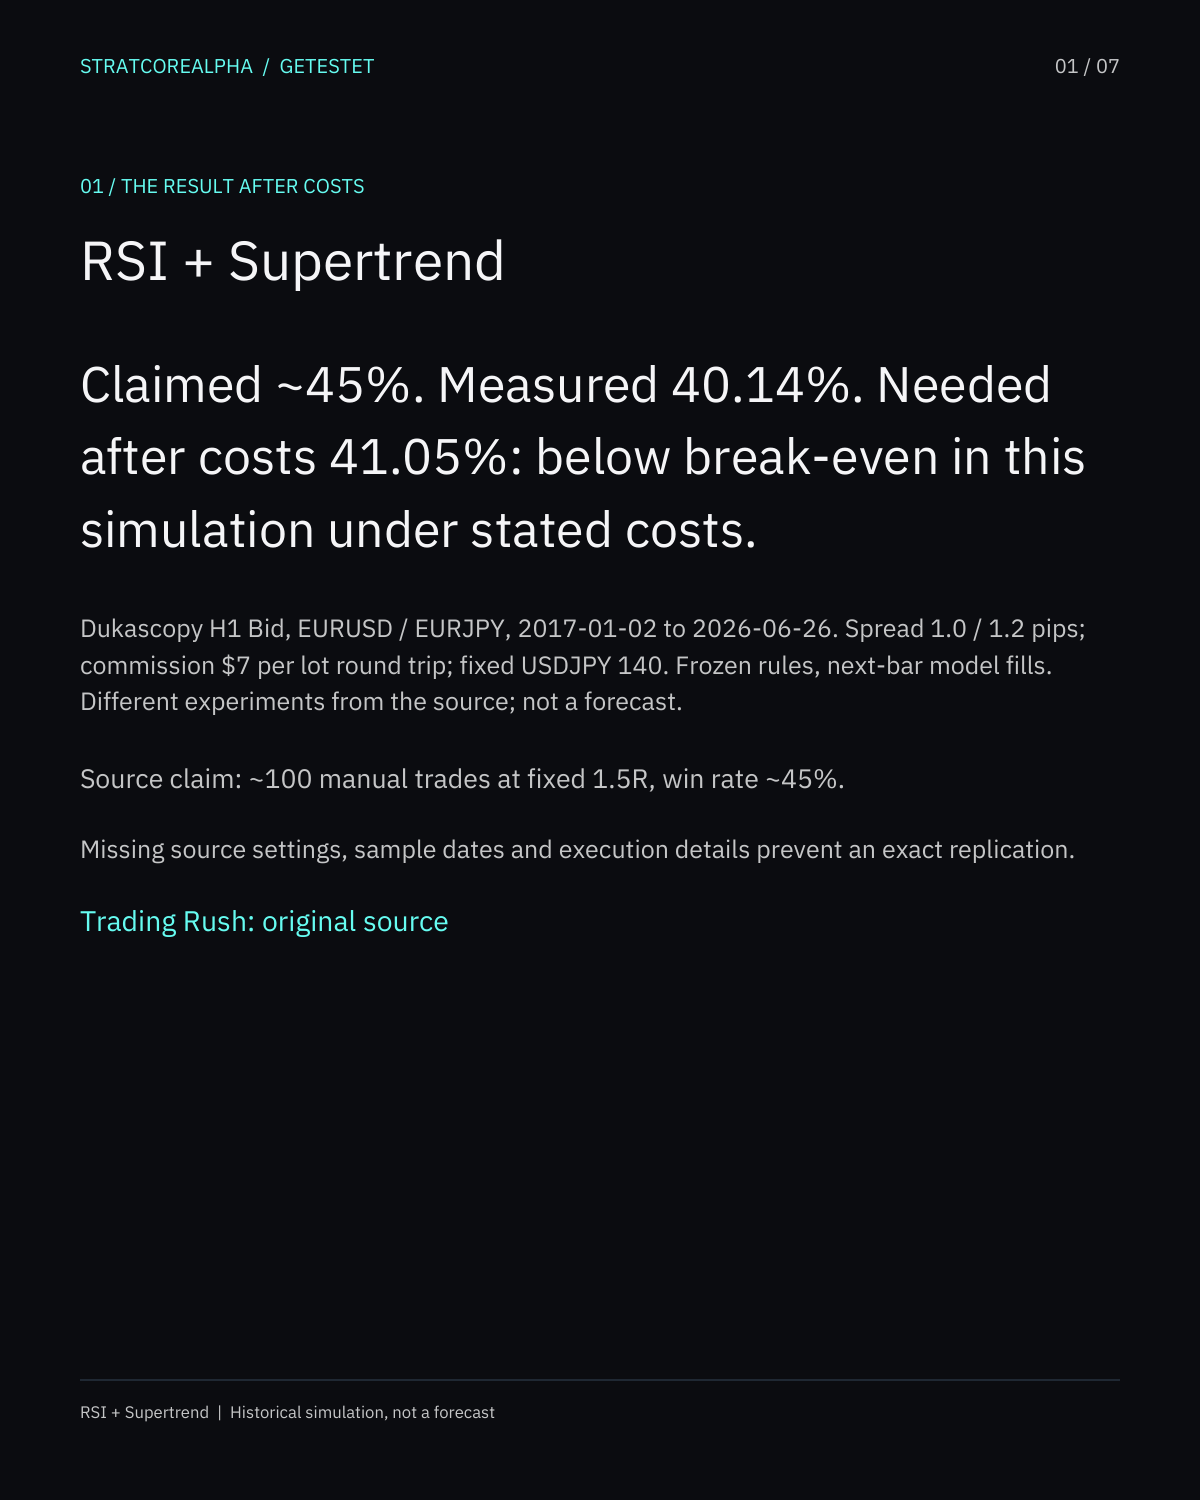
Claimed ~45%. Measured 40.14%. Needed after costs 41.05%: below break-even in this simulation under stated costs.
Measured under the frozen rules
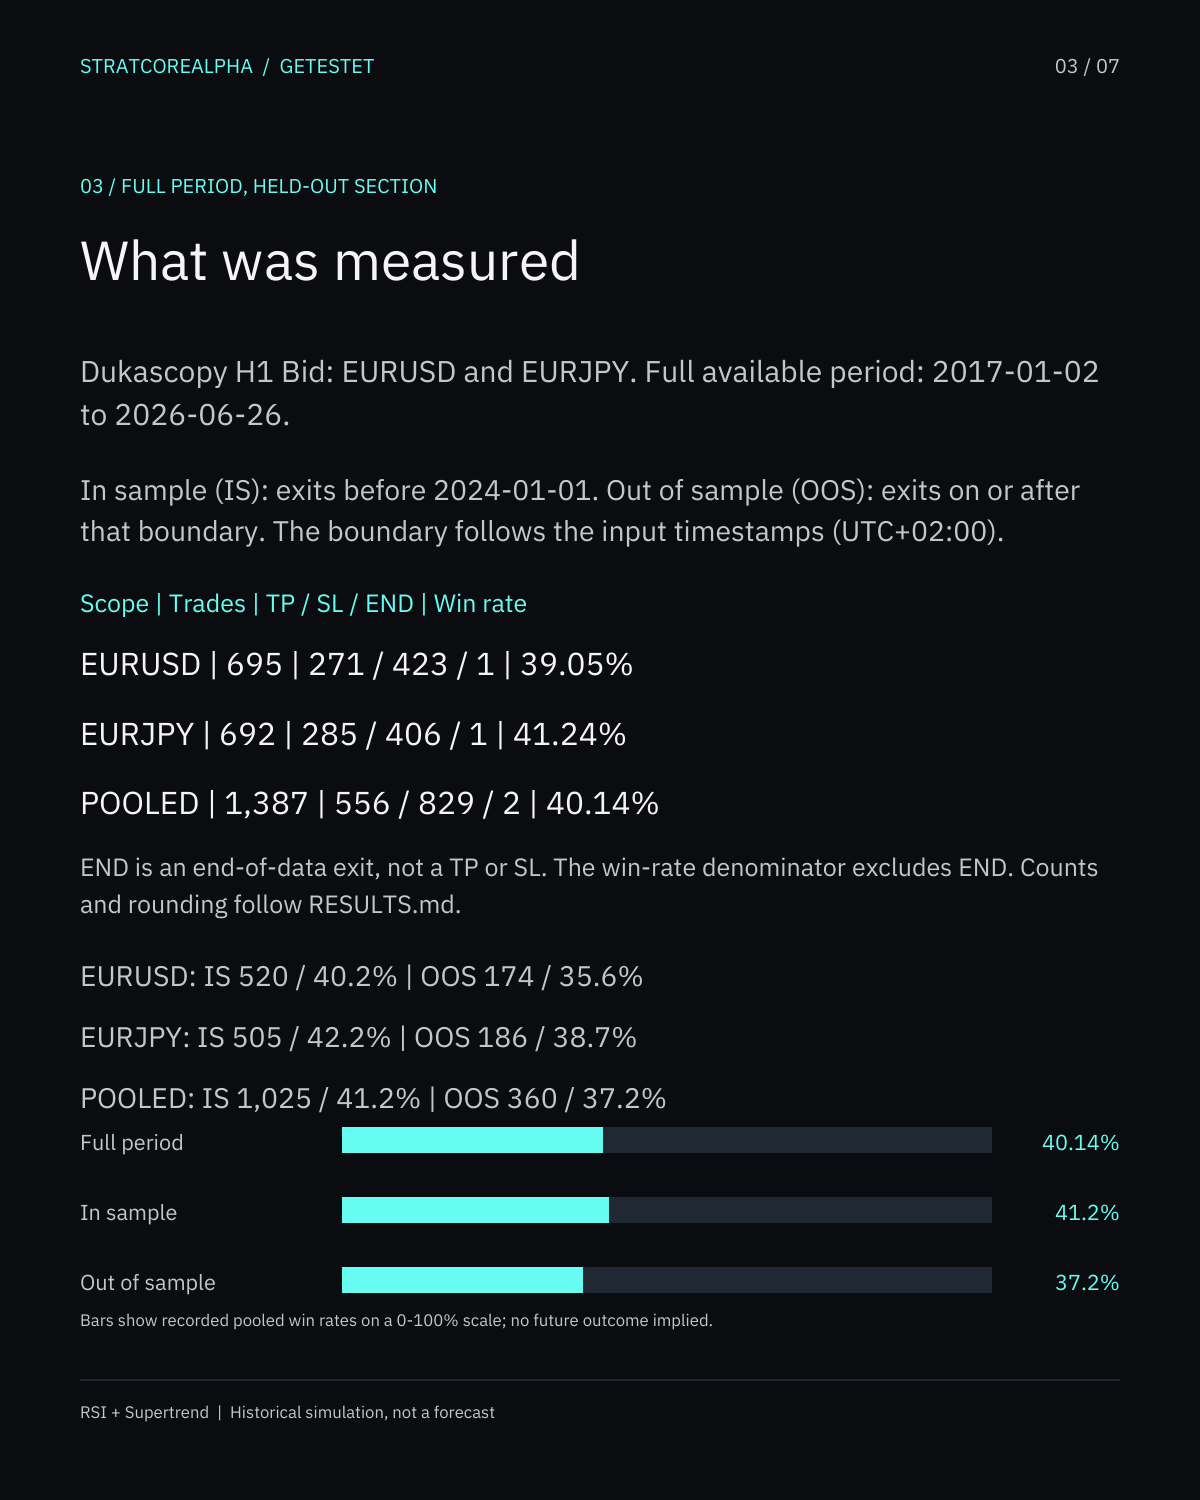
40.14%1,387 trades, 556 TP / 829 SL, win rate 40.14%.
The source and this run are different experiments. Missing settings and sample details prevent an exact replication. Model fills are not observed broker execution. No profit or challenge-pass claim.
Trading Rush reported a win rate around 45% after manually testing roughly 100 trades with RSI and Supertrend. RSI is a momentum measure; Supertrend is a line that sits on one side of price to show its current trend state. Combining them sounds precise until you ask when RSI must cross a threshold, when Supertrend must agree, and where a stop is set. Those details decide which trades exist.
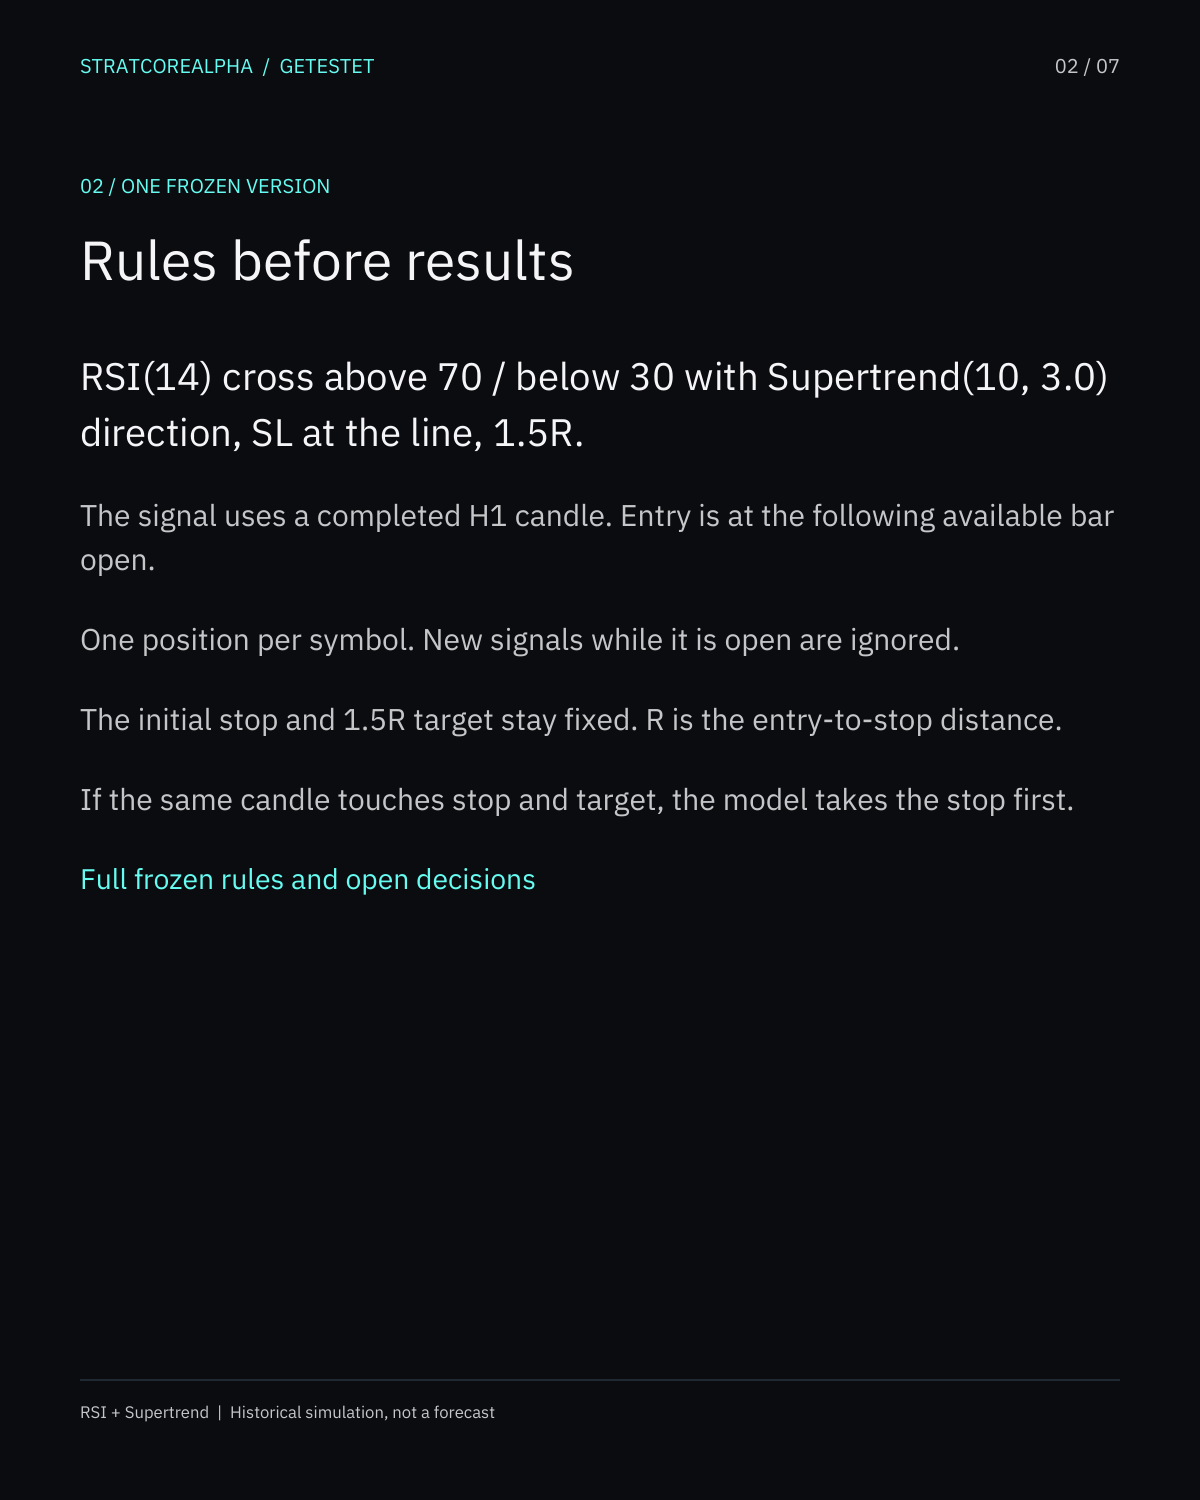
I wrote down one interpretation before counting. RSI has a 14-bar period. A long signal requires RSI to cross above 70 on a completed hourly candle and Supertrend to point up. A short requires RSI to cross below 30 and Supertrend to point down. I enter at the following hour's open. The stop sits at the Supertrend line recorded on the signal bar; the target is 1.5 times that initial risk. Only one trade per symbol can be open at a time.
This is my frozen test, not an exact copy of the video's private manual sample. The rule sheet marks what the source says and what I chose where it is silent. Anyone who wants to automate the idea needs the same distinction. A change from crossing 70 to merely staying above 70 can produce many more signals without changing the label “RSI plus Supertrend.”
Whole-period measurement
The data are official Dukascopy EURUSD and EURJPY hourly Bid candles. I used the entire available span from 2 January 2017 through 26 June 2026. I did not choose a strong month after seeing the chart. The base interpretation produced 1,387 trades, including two positions closed only by the end of the sample. Of the trades with a stop or target exit, 556 hit the target and 829 hit the stop. The reported base win rate over all 1,387 trades is 40.14%. EURUSD measured 39.05% and EURJPY 41.24%.
The in-sample and held-out sections were fixed at 1 January 2024, using the exit timestamp. The in-sample rate was 41.2% on 1,025 trades. The out-of-sample rate was 37.2% on 360. Two positions at the sample end are a reminder that a strategy's result also depends on how unfinished trades are handled. They are identified in the CSV; they are not silently turned into wins.
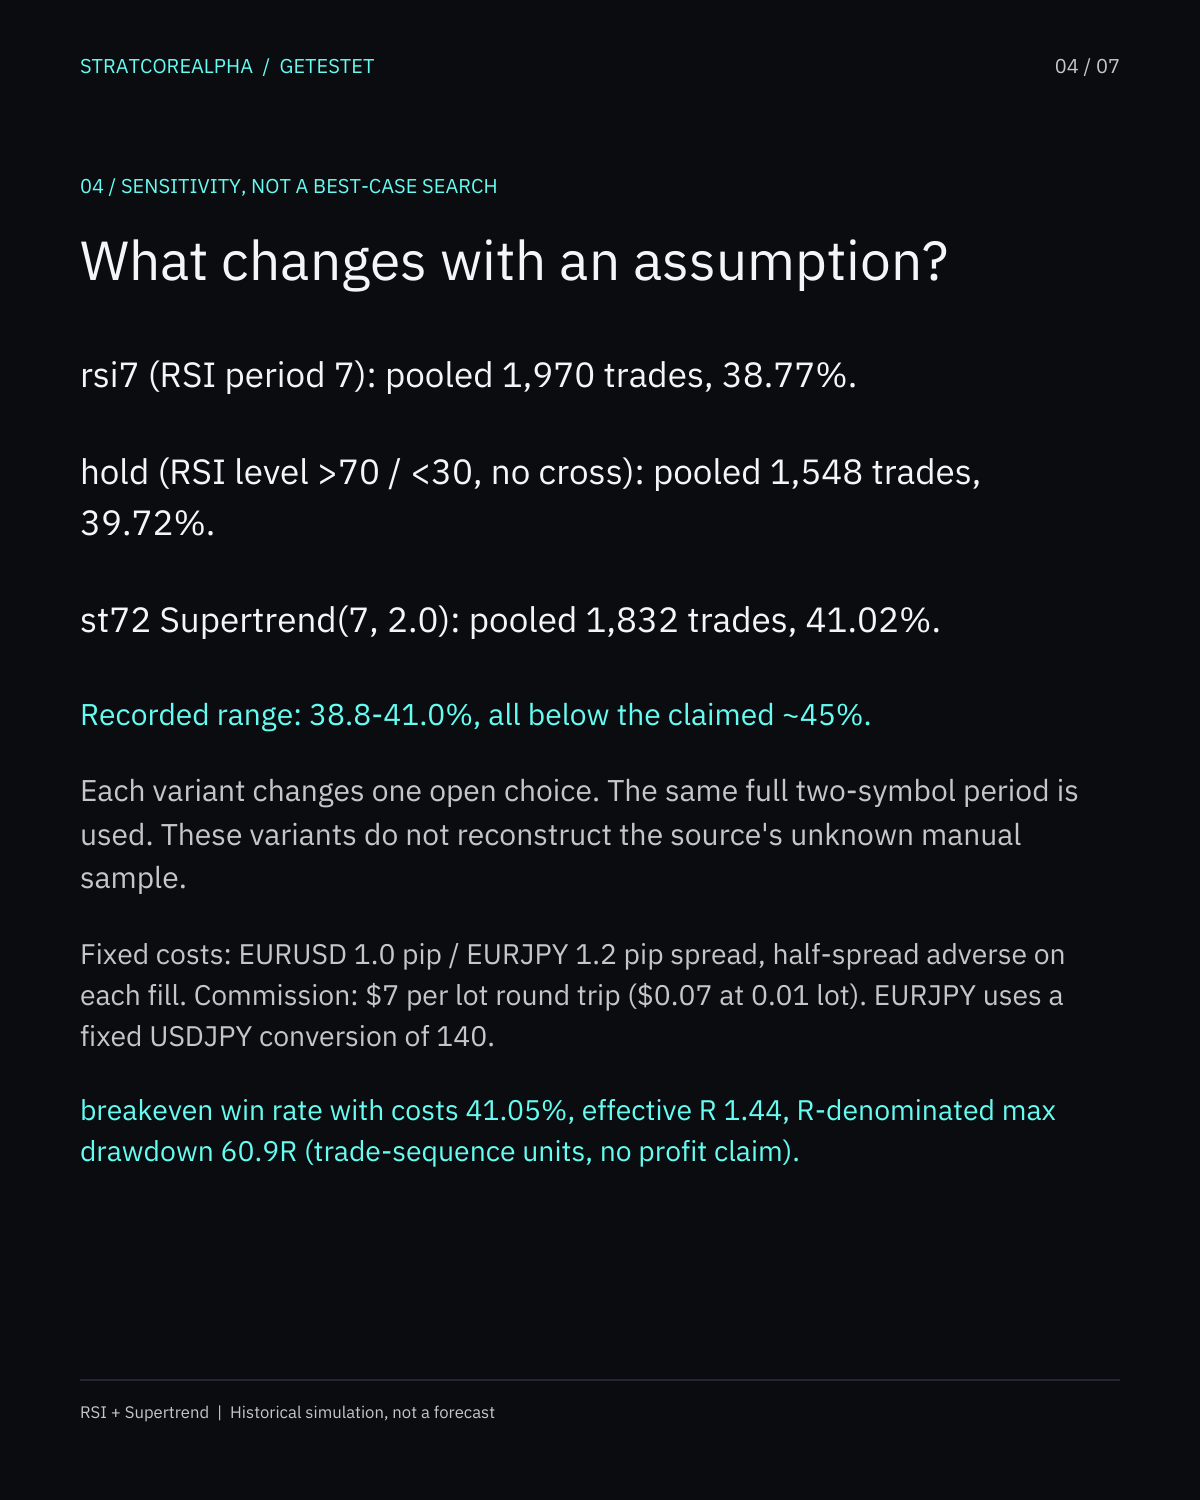
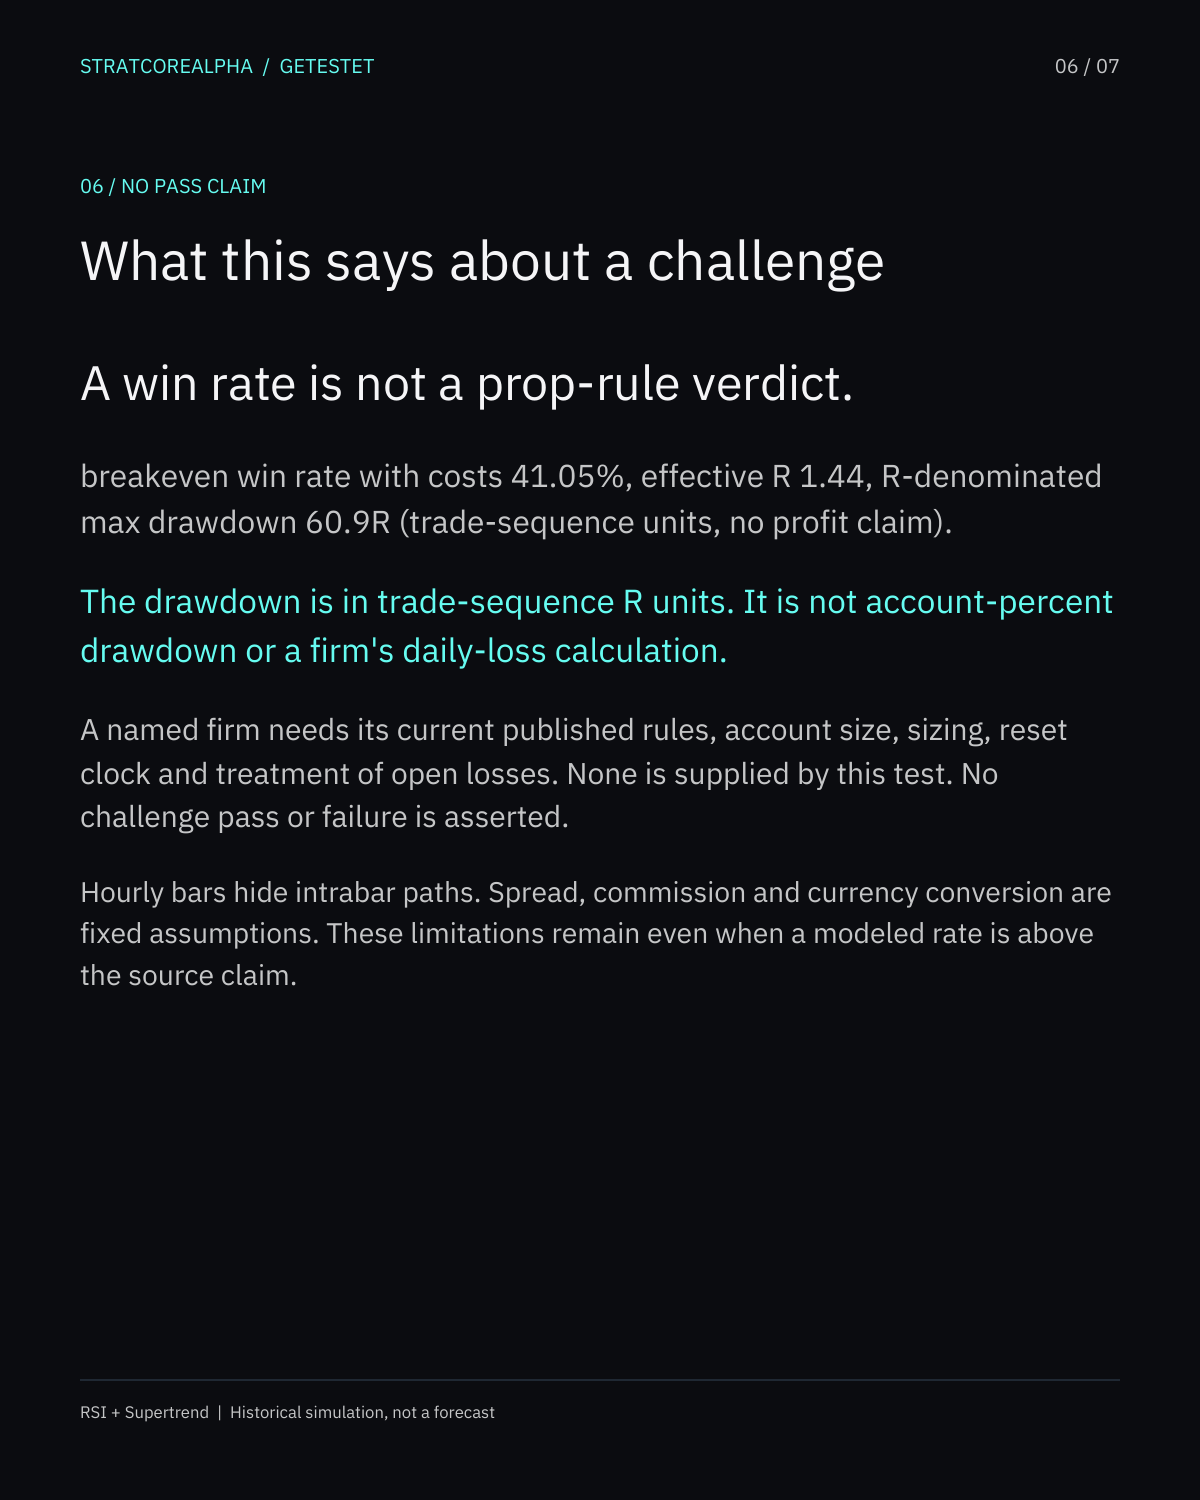
Bid data do not contain the Ask price paid when buying. I modeled a fixed 1.0-pip spread on EURUSD, 1.2 pips on EURJPY, and $7 per standard lot round-trip commission. For the EURJPY conversion I fixed USDJPY at 140. Those are transparent assumptions, not observed historical trading costs. At the modeled 1.5R payout, the with-cost breakeven rate was 41.05%. The base 40.14% is below it. The largest drawdown in the sequence of modeled R results was 60.9R. These figures describe this simulation and offer no future-profit claim.
What changed when I moved one rule
Three single-choice variants test the open points. Shortening RSI to seven bars yielded 38.77% wins over 1,970 trades. Using the state “above 70” or “below 30” in place of a fresh crossing yielded 39.72% over 1,548. A faster Supertrend setting yielded 41.02% over 1,832. The range is 38.8% to 41.0%. Each version remains a different specification from the video unless its exact settings are known.
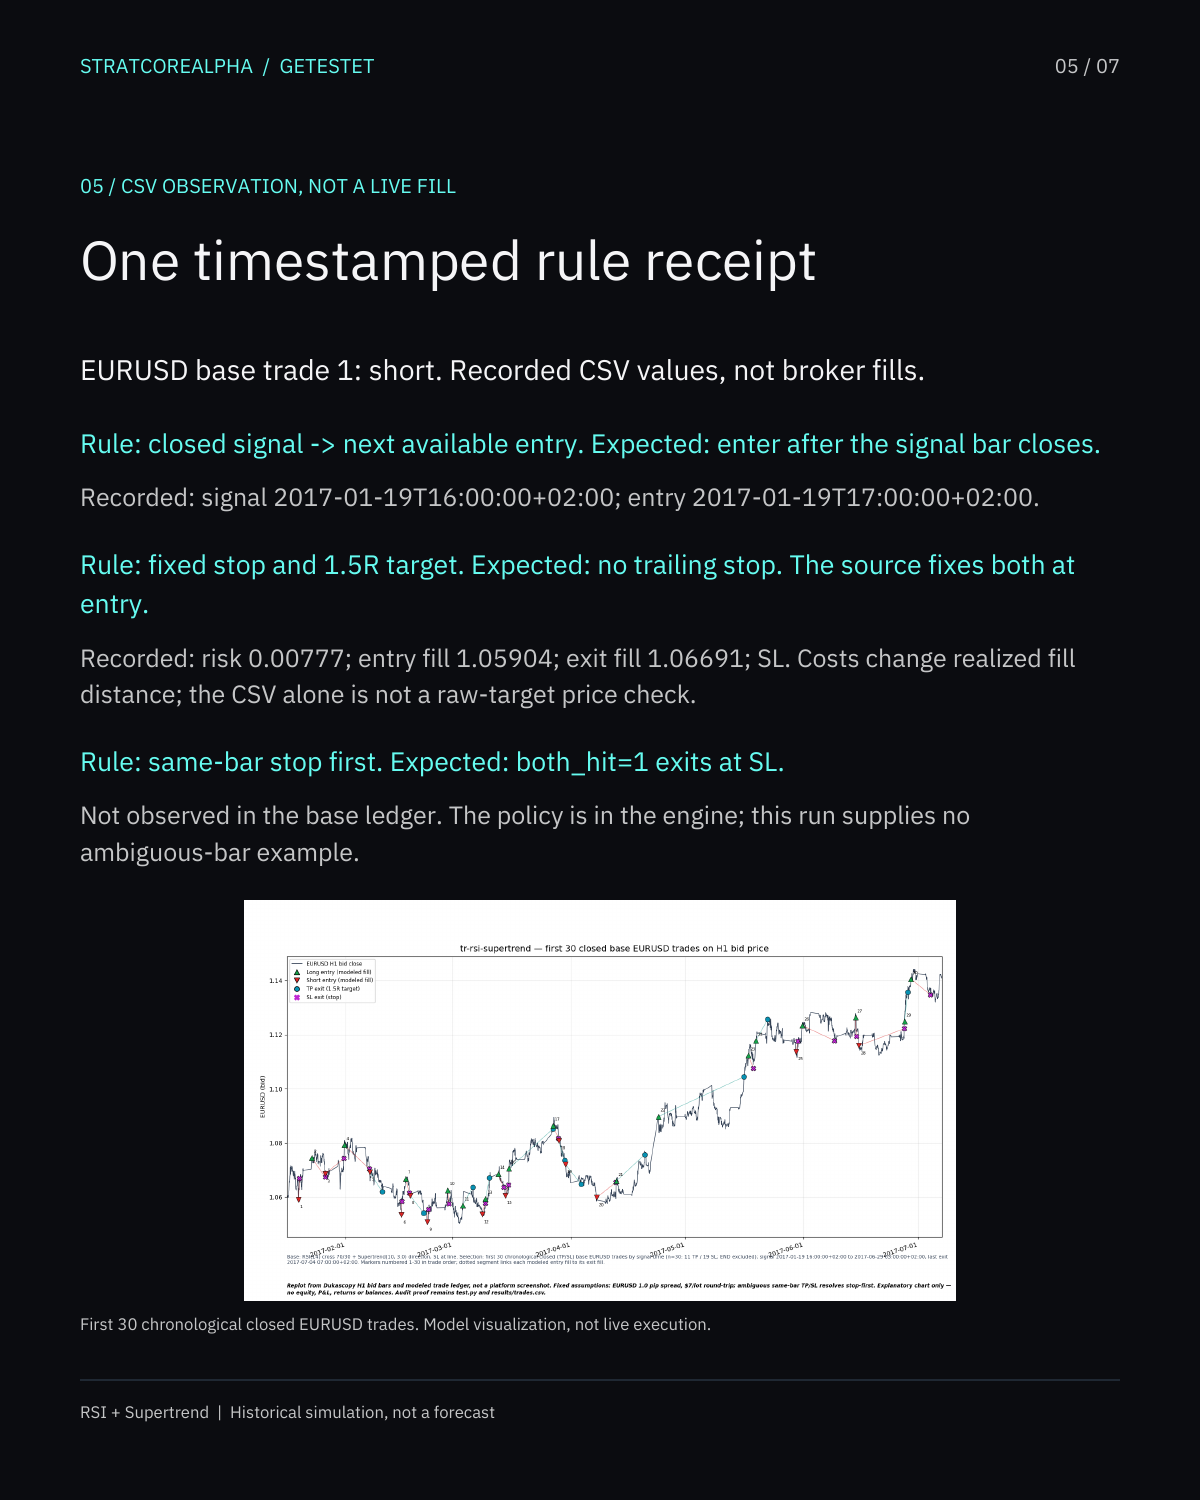
Here are three acceptance cases I would give a developer. First, show an RSI value just below 70 followed by a closed value just above 70 while Supertrend points up. Exactly one long signal should be eligible on the next open. Second, show RSI already above 70 for several candles: the crossing version should not enter again on every candle. Third, show a trade where the hourly high and low touch both target and stop. The bar data do not tell us which came first, so the frozen test takes the stop first. That ambiguity affected no pooled base trade here, but the policy is still part of the rule.
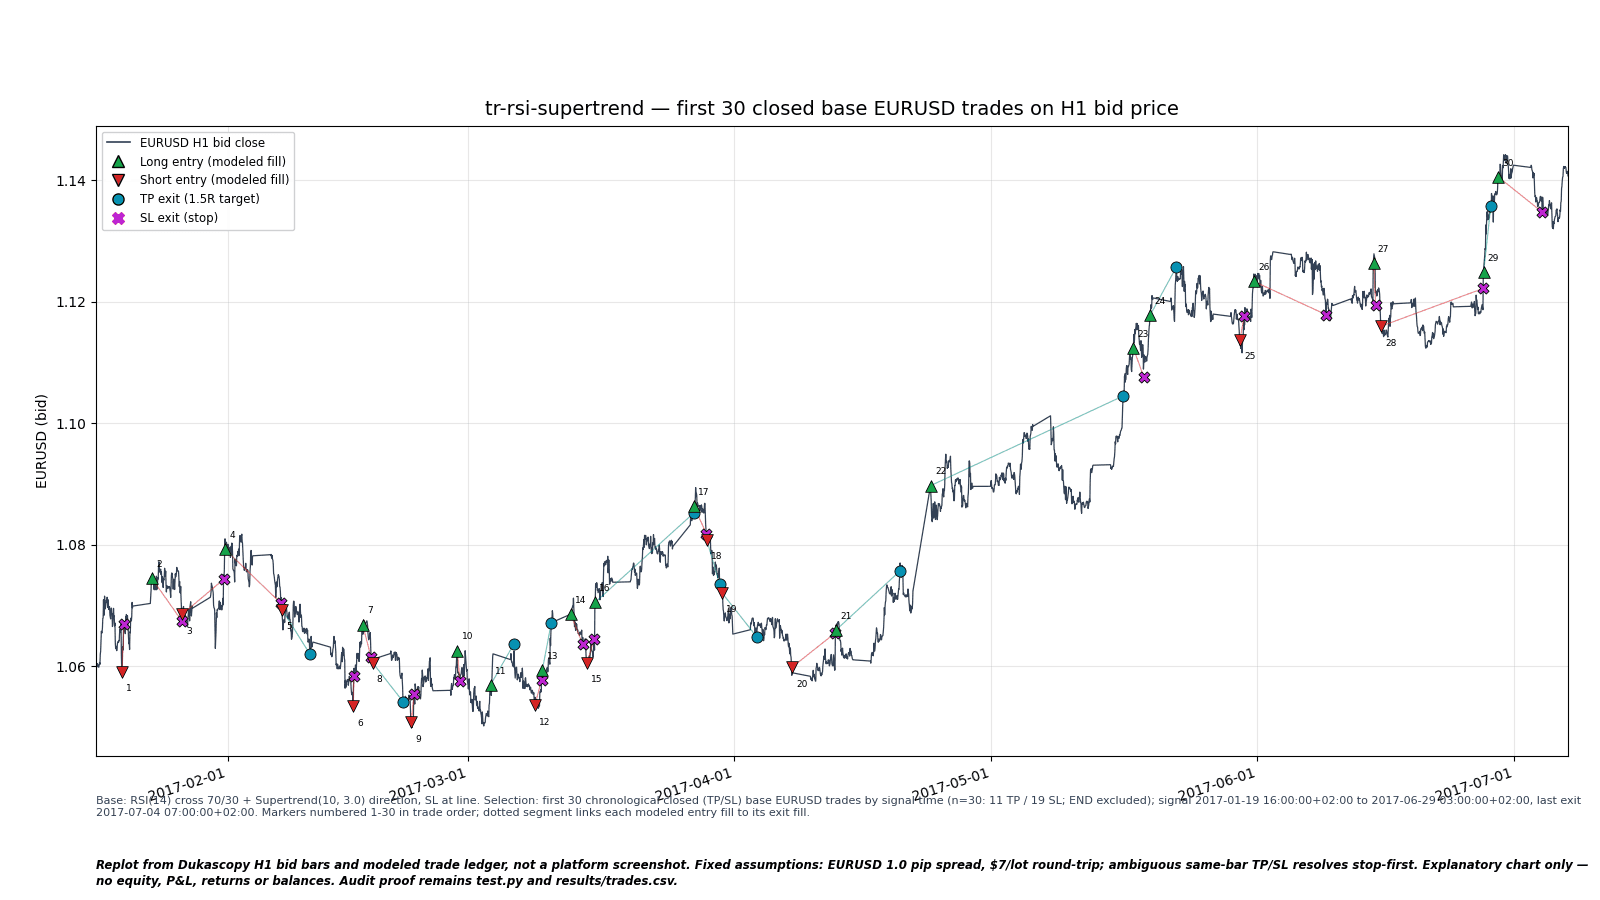
The script, summary and trade ledger let someone inspect every modeled entry and exit. The explanatory chart shows the first 30 chronological EURUSD trades, not a chosen winning segment. The model uses hourly candles and cannot prove the intrabar path, fill quality or live operation.
For a strategy someone is considering for MT5, the useful first step is a written choice between a threshold crossing and a threshold state. The rule check collects that kind of decision before a historical test. A headline rate without the event definition cannot tell a developer what to build.
The recorded result
Full period and held-out trades
Dukascopy H1 Bid, 2017-01-02 to 2026-06-26. Split by exit timestamp at 2024-01-01 in the input timezone (UTC+02:00). END is an end-of-data exit and is excluded from the TP/SL win-rate denominator.
| Scope | Trades | TP | SL | END | Win rate | IS (n/rate) | OOS (n/rate) |
|---|---|---|---|---|---|---|---|
| EURUSD | 695 | 271 | 423 | 1 | 39.05% | 520 / 40.2% | 174 / 35.6% |
| EURJPY | 692 | 285 | 406 | 1 | 41.24% | 505 / 42.2% | 186 / 38.7% |
| POOLED | 1,387 | 556 | 829 | 2 | 40.14% | 1,025 / 41.2% | 360 / 37.2% |
Fixed assumptions: EURUSD 1.0 pip and EURJPY 1.2 pips spread; half-spread adverse on every fill. Commission $7 per lot round trip, $0.07 at 0.01 lot. EURJPY conversion uses fixed USDJPY 140. breakeven win rate with costs 41.05%, effective R 1.44, R-denominated max drawdown 60.9R (trade-sequence units, no profit claim).
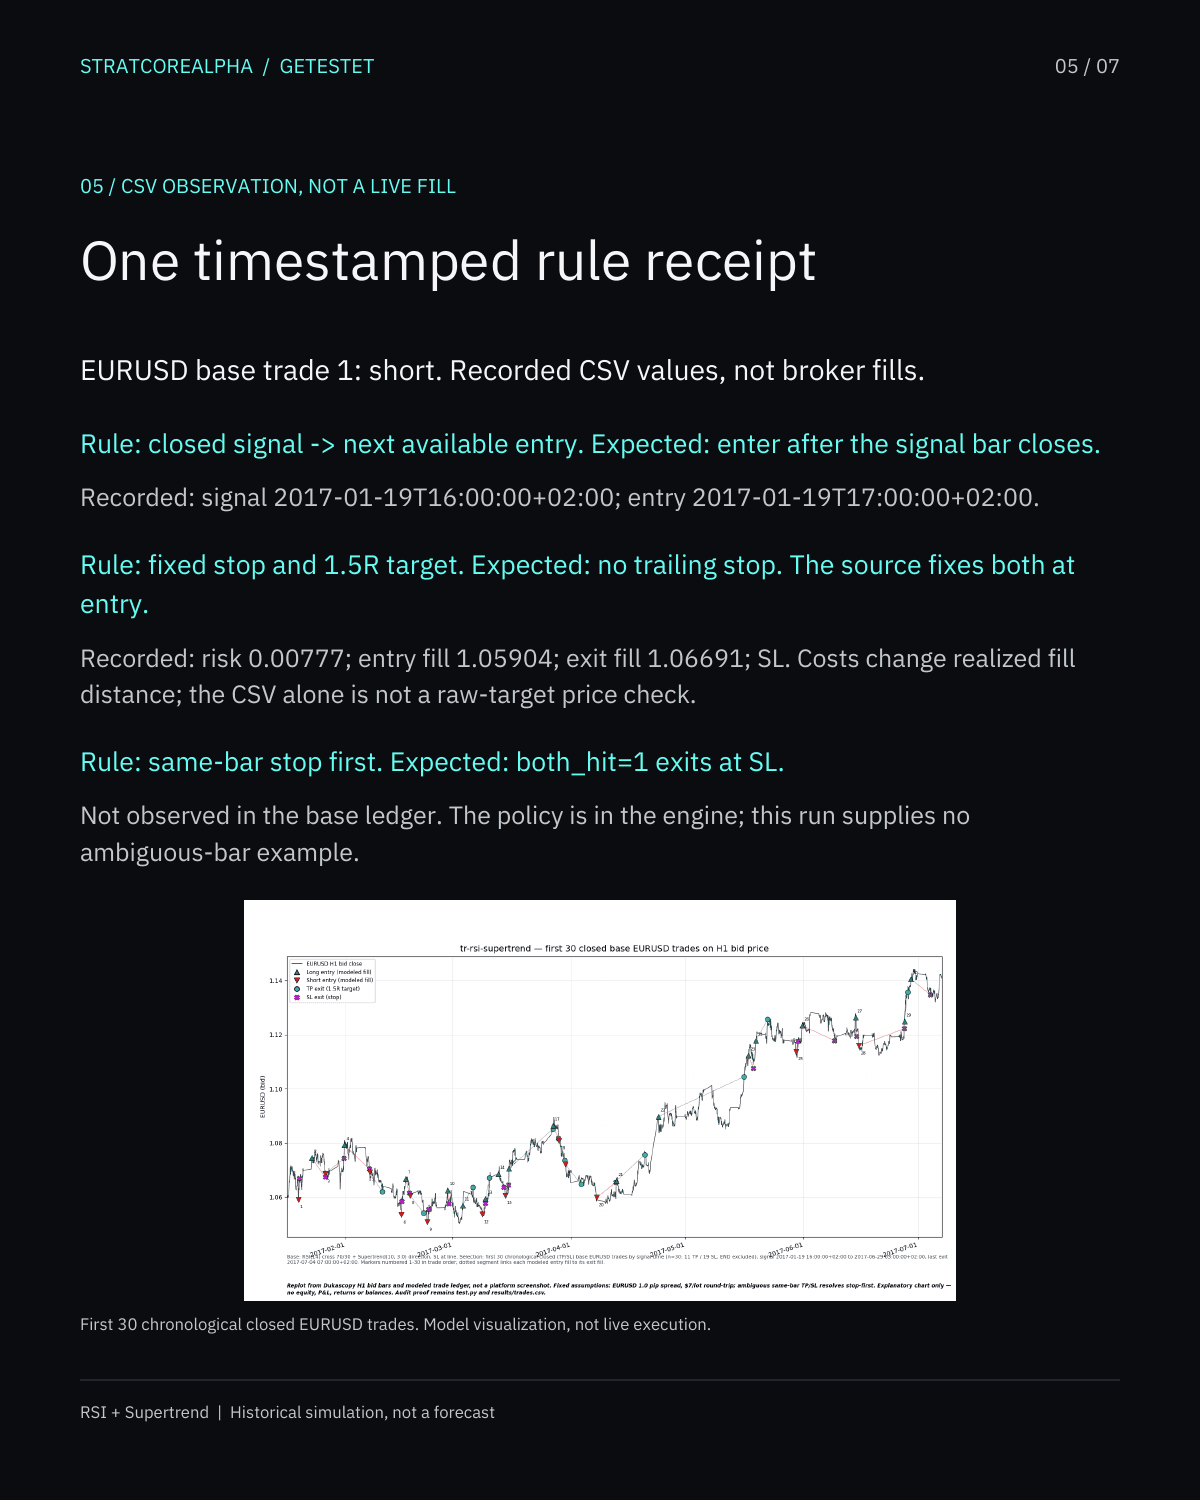
Public rule receipt
Expected rule beside the recorded output
Closed signal and next entry, fixed stop/target, and the same-bar policy. The CSV excerpt names what is observed and what the ledger cannot prove.
No email gate
Seven-page case study and audit files
The PDF and PNG pages share the same content. The CSVs, frozen rules and source code show what was counted. Raw Dukascopy candles are not redistributed.
PNG pages for reading or sharing
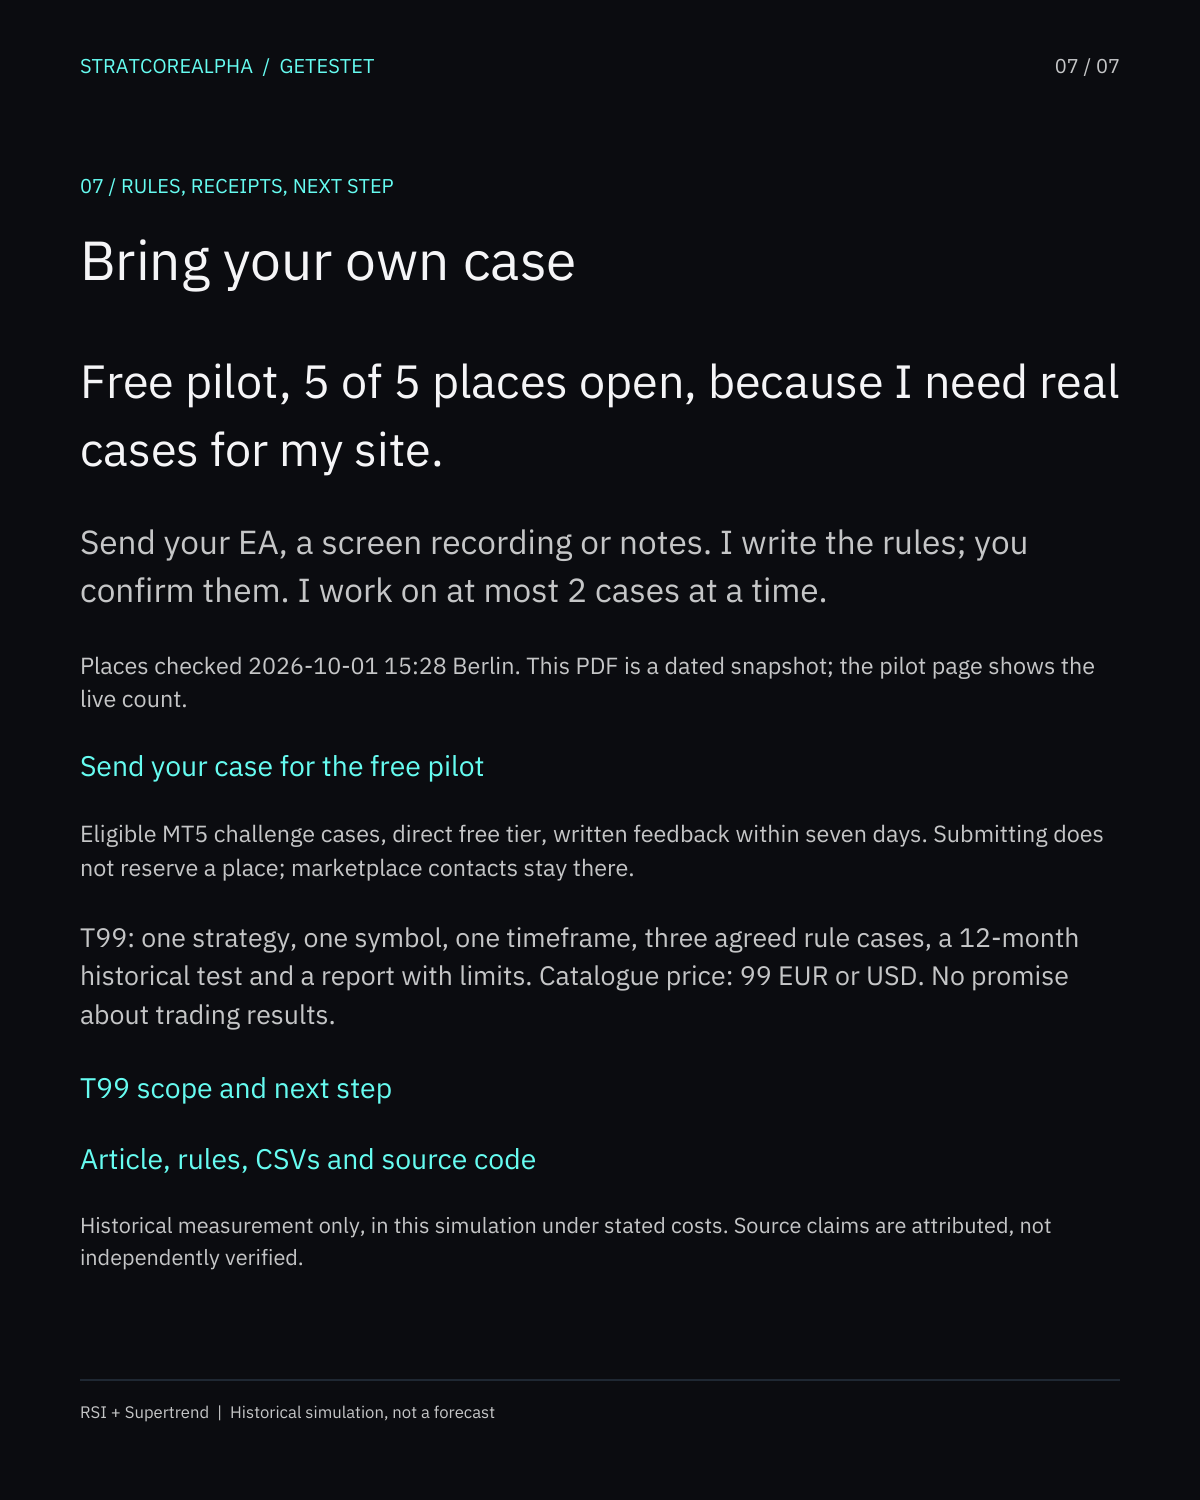
Your own case
An EA, a video or notes are enough to start
I write the rules; you confirm them. The direct pilot follows the T99 scope with written feedback within seven days. Current eligibility, allocation and terms are on the pilot page.
I take 5 cases free because I need real cases for my site. Loading the live number of places.
Send your EA, a video or your notesT99 is 99 EUR or USD: one strategy, one symbol, one timeframe, three agreed rule cases, a 12-month historical test and a report with limits. Historical outcomes are not forecasts.